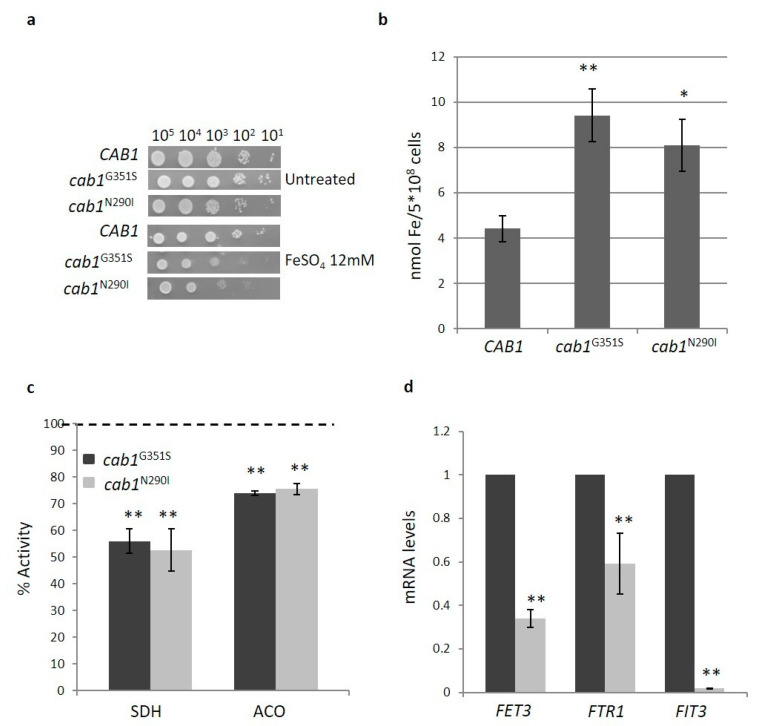
Figure 3.
(a) Iron sensitivity. Equal amounts of serial dilutions of cells from exponentially grown cultures (105, 104, 103, 102, 101 cell/spot) were spotted onto SC medium supplemented with 12 mM FeSO4. The growth was scored after 3 days of incubation at 28 °C. The experiment was performed on at least three independent clones for each strain (N = 2; n = 6). (b) Cellular iron content was quantified in cells grown to the early stationary phase in SC medium plus 2% galactose. Values are means ± standard deviation. N = 3; n = 12 for each strain. *: p < 0.05; **: p < 0.01. (c) Succinate dehydrogenase (SDH) and aconitase (ACO) activities were measured in mitochondrial-enriched fraction or whole-cell extracts as described in ‘Material and Methods’. The activities were normalized to the strain transformed with the CAB1 wild-type allele. Values are means ± standard deviation. N = 3; n = 9 for each strain. **: p < 0.01. (d) The total RNA was extracted from wild-type and mutant strain grown in SC medium plus galactose 2% as described in ‘Materials Methods’. The mRNA levels of iron regulon genes were quantified by RT-qPCR. Values are reported as mRNA level normalized with respect to wild-type. Expression of FET1, FTR1, and FIT3 was normalized to the mRNA levels of the internal control ACT1. Values are means ± standard deviation. N = 1; n = 9 each strain. **: p < 0.01.

