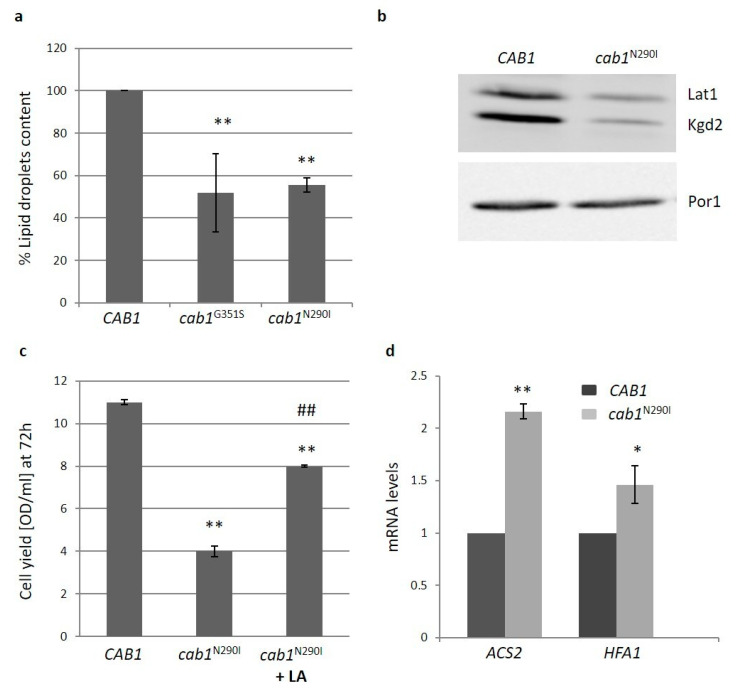
Figure 5.
(a) The intracellular lipid droplets content was detected by fluorimetric analysis after incubation of wild-type and mutant strains with the fluorescent lipophilic dye Nile Red (4ug/mL). The values corresponding to cab1 mutants were normalized to the strain transformed with the CAB1 wild-type allele. Values are means ± standard deviation. N = 3; n = 9 for wild-type and cab1G351S strains, n = 12 for cab1N290I strain. **: p < 0.01. (b) Representative image of western blot analysis of lipoylated subunits of PDH (Lat1p) and α-KGDH (Kgd2) extracted from strain harboring pFL39CAB1 or pFL39cab1N290I. N = 3; n = 3 for each strain. (c) Cell Yield (OD600/mL) was evaluated by growing wild-type and mutant strains in SC medium containing 2% ethanol for 72 h in the presence of 100 mM Lipoic Acid (LA). Values are means ± standard deviation. N = 1; n = 6 for each strain and condition. **: p < 0.01 relative to CAB1 wild-type strain and ##: p < 0.01 relative to cab1N290I mutant strain. (d) The total RNA was extracted from cells grown in SC medium plus glucose 0.6%. The mRNA level of ACS2 and HFA1 genes was quantified by RT-qPCR. Values are reported as mRNA level normalized respect to wild-type Expression of ACS2 and HFA1 was normalized to the mRNA levels of the internal control ACT1. Values are means ± standard deviation. N = 1; n = 9 for each strain. *: p < 0.05; **: p < 0.01.

