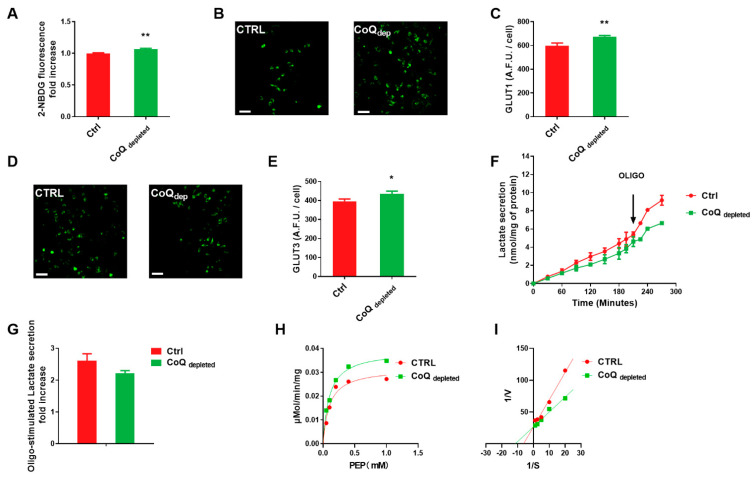
Figure 3.
Glucose uptake and metabolism in CoQ depleted cells. MCF-7 cells were cultured in complete DMEM for 96 h in the presence of 4 mM 4-nitrobenzoic acid (CoQ depleted) or vehicle (CTRL). (A) Glucose uptake determination in MCF-7 cells using the glucose fluorescent analogue 2-deoxy-2-((7-nitro-2,1,3-benzoxadiazol-4-yl)amino)-D-glucose (2-NDBG). (B) Representative micrographs and their quantification (C) of GLUT1 immunostaining in control and CoQ depleted cells. (D) Representative micrographs and their quantification (E) of GLUT3 immunostaining in control and CoQ depleted cells. Scale bar: 70 µm. (F) Lactate secretion determination in culture medium from control and CoQ depleted cells. 1µM Oligomycin A was added to maximize the lactate production. Lactate was quantified by HPLC and the data were normalized on cellular protein content. (G) Fold increase of cellular lactate secretion after oligomycin A addition in control and CoQ depleted cells. (H) Michaelis and Menten and (I) Lineweaver-Burke plots of pyruvate kinase (PK) activity obtained in the presence of increasing concentrations of phosphoenolpyruvate (PEP) in control and CoQ depleted cells. Statistical analysis was performed using GraphPad Prism software. Error bars indicate the standard error of the mean (SEM). p values were obtained using unpaired t-test with Welch’s correction. * p ≤ 0.05; ** p ≤ 0.01.

