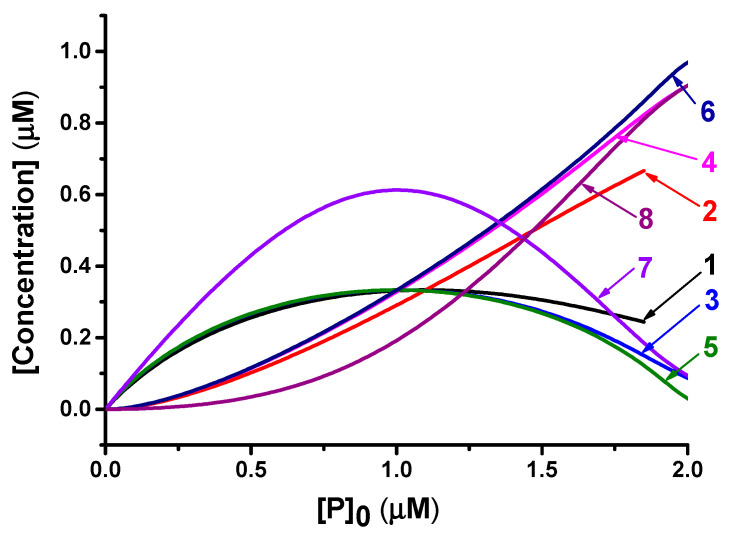
Figure 4.
Equilibrium concentrations of PAb and P2Ab complexes. Model parameters: [Ab]0 = 1 µM; 1. [PAb] at Kd1 = Kd2 = 0.1 µM; 2. [P2Ab] at Kd1 = Kd2 = 0.1 µM; 3. [PAb] at Kd1 = Kd2 = 0.01 µM; 4. [P2Ab] at Kd1 = Kd2 = 0.01 µM; 5. [PAb] at Kd1 = Kd2 = 0.001 µM; 6. [P2Ab] at Kd1 = Kd2 = 0.001 µM; 7. [PAb] at Kd1 = 0.001 µM, Kd2 = 0.01 µM; 8. [P2Ab] at Kd1 = 0.001 µM, Kd2 = 0.01 µM.

