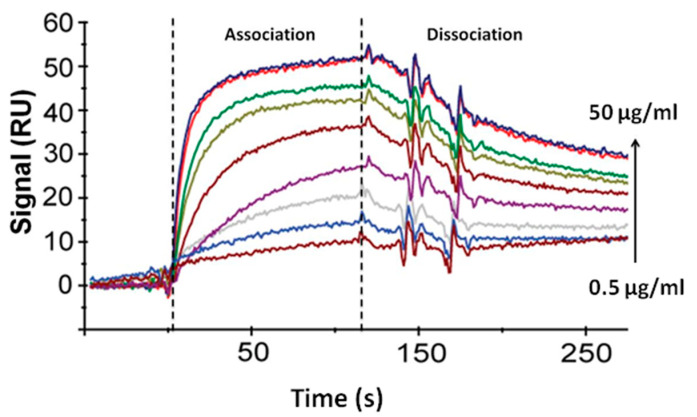
Figure 5.
Sensograms of the interaction of the Rv0934 antigen with the surface of the CM5 chip modified with the HTM81 antibodies. Antigen concentration 0.5; 1; 3; 5; 10; 20; 30; 40; and 50 μg/mL. Dotted lines show the beginning and end of the time interval for the flow of antigen solutions through the sensor cell. The signal is the difference between RU values in the analytical cell and the comparison cell.

