Figure 7.
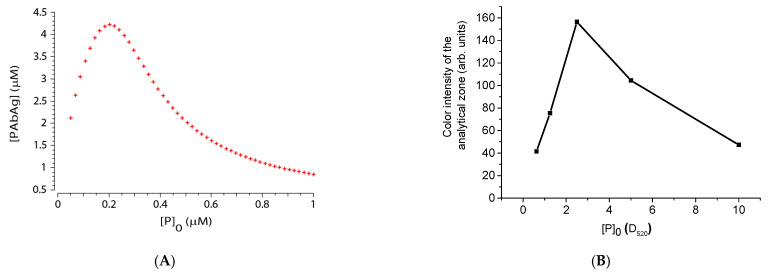
Dependences of analyte determination at different concentrations of labeled antigen (A) Theoretical dependence obtained by numerical simulation. Model parameters: T = 60 s; [P]0 = 5 × 10⁻⁷ M; [Ag]0 = 10−5 M; ka = 105 1/(M*s); kd = 2.5 × 10⁻³ 1/s. (B). Experimental values of the color intensity (signal from the Reflekom analyzer) of analytical zones after the assay at different optical densities (D520) of the label conjugate.

