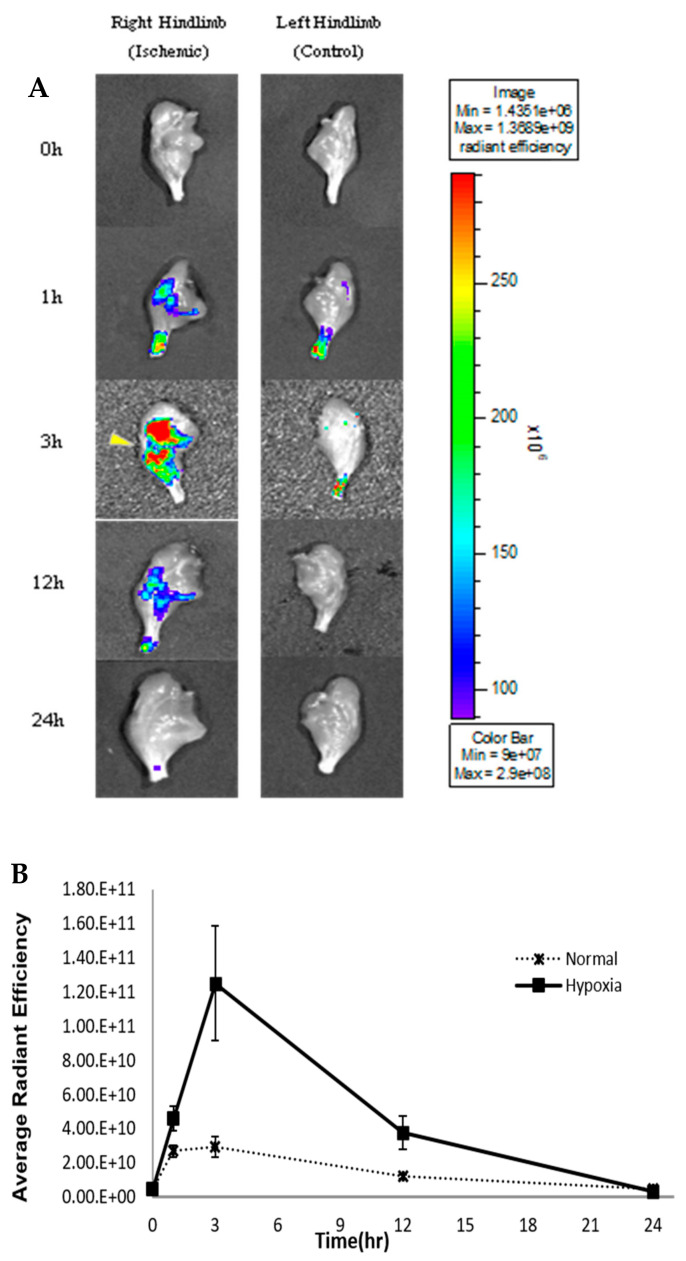
Figure 3.
In vivo fluorescence imaging of endogenous H2S by fluorescence probe in a rat model. (A) Fluorescence images (Lumina II) at the following time points: 0, 1, 3, 12 and 24 h. Left legs show normal and right legs show hypoxic conditions (n = 4). Yellow triangle represents hypoxic region. (B) Fluorescence intensity of both normal and ischemic regions across 24 h.

