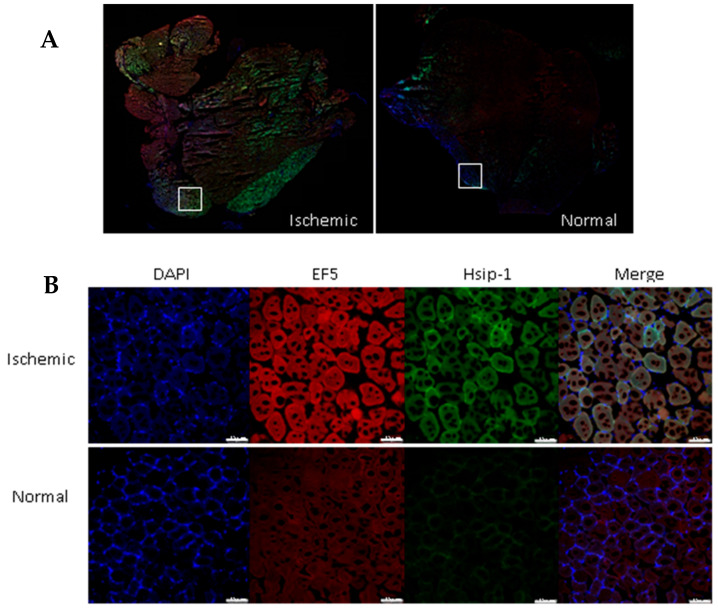
Figure 4.
Immunofluorescence staining of hindlimb sections. (A) Fluorescence images of ischemic and normal tissue. Tissue imaging was performed with a confocal microscope. Original magnification: 100×. (B) Red indicates EF5 (hypoxia detection), green indicates HSip-1 (H2S detection), and blue indicates DAPI (nuclei). Original magnification: 400×; scale bars, 75 µm.

