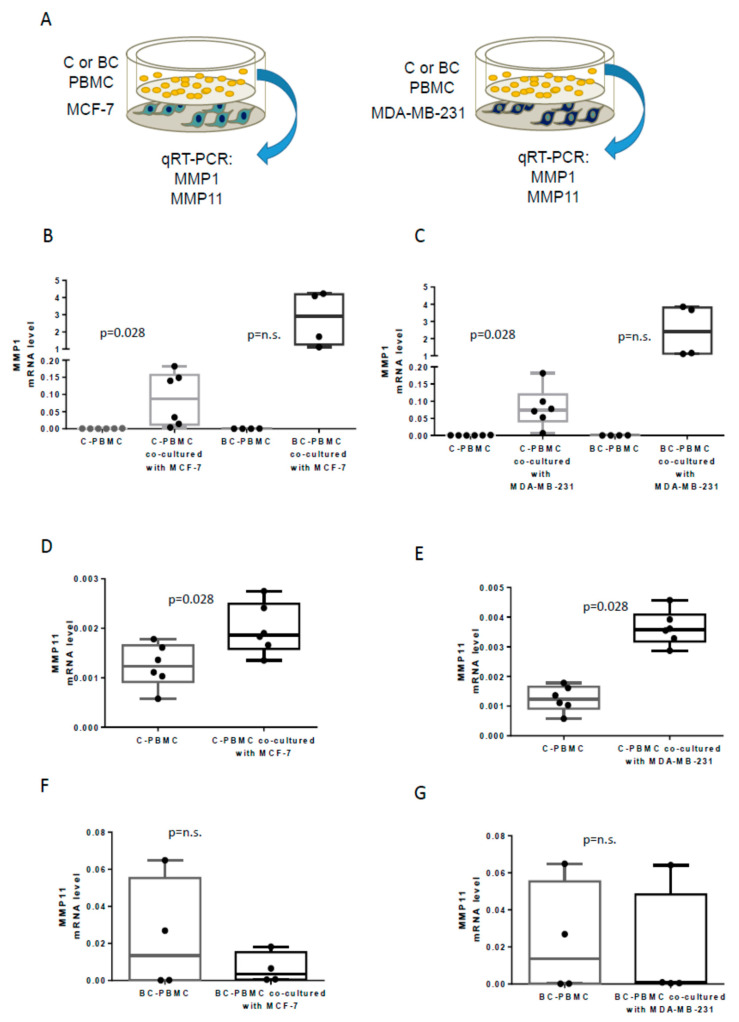
Figure 2.
MMP1 and MMP11 gene expression in PBMC after co-culture with breast cancer cell lines. Scheme of experimental design (A). MMP1 gene expression in PBMC from healthy women (controls, C-PBMC, n = 6) and in PBMC from breast cancer patients (BC-PBMC, n = 4) before and after co-culture with MCF-7 (B) and MDA-MB-231 (C) breast cancer cell lines. MMP11 gene expression in C-PBMC before and after co-culture with MCF-7 and MDA-MB-231 breast cancer cell lines (n = 6) (D,E) and in BC-PBMC after the same co-culture conditions (n = 4) (F,G). (n.s.: not significant). Results of the qRT-PCR data were represented as ΔΔCT values.

