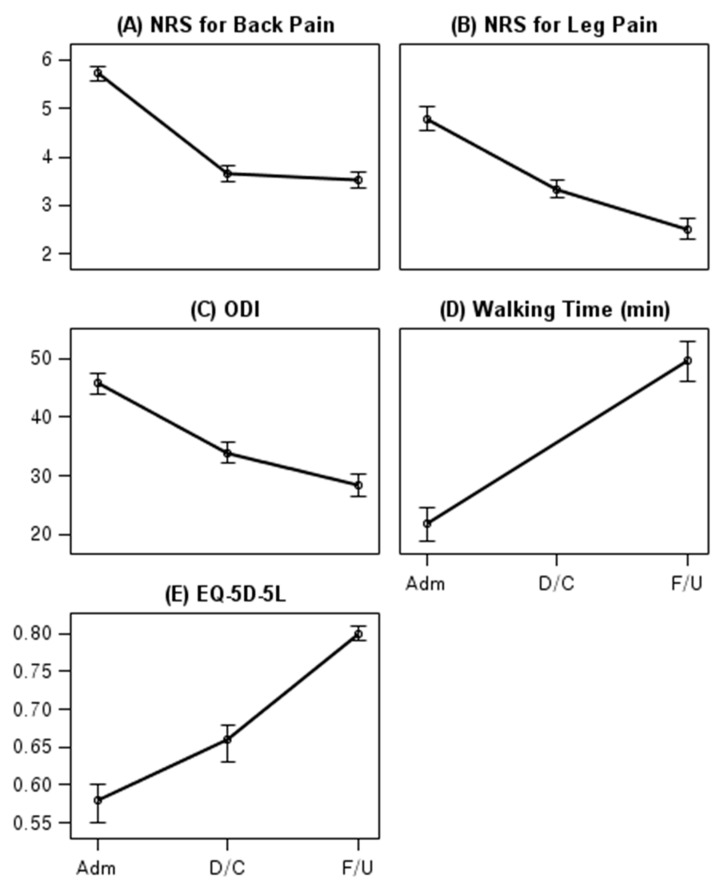
Figure 2.
Changes in main outcomes at admission, discharge, and long-term follow-up. Outcome changes at baseline, discharge, and long-term follow-up are illustrated, with 95% confidence intervals represented by vertical bars. Plots and 95% confidence intervals were determined using a linear mixed model. (A) NRS for back pain on 11-point scale, (B) NRS for leg pain on 11-point scale, (C) ODI is presented as points, whereas (D) walking time without pain is presented in minutes (E) EQ-5D-5L to evaluate the participants’ quality of life is presented. NRS, numeric rating scale; ODI, Oswestry Disability Index; EQ-5D-5L, five-level EuroQol 5-dimension.

