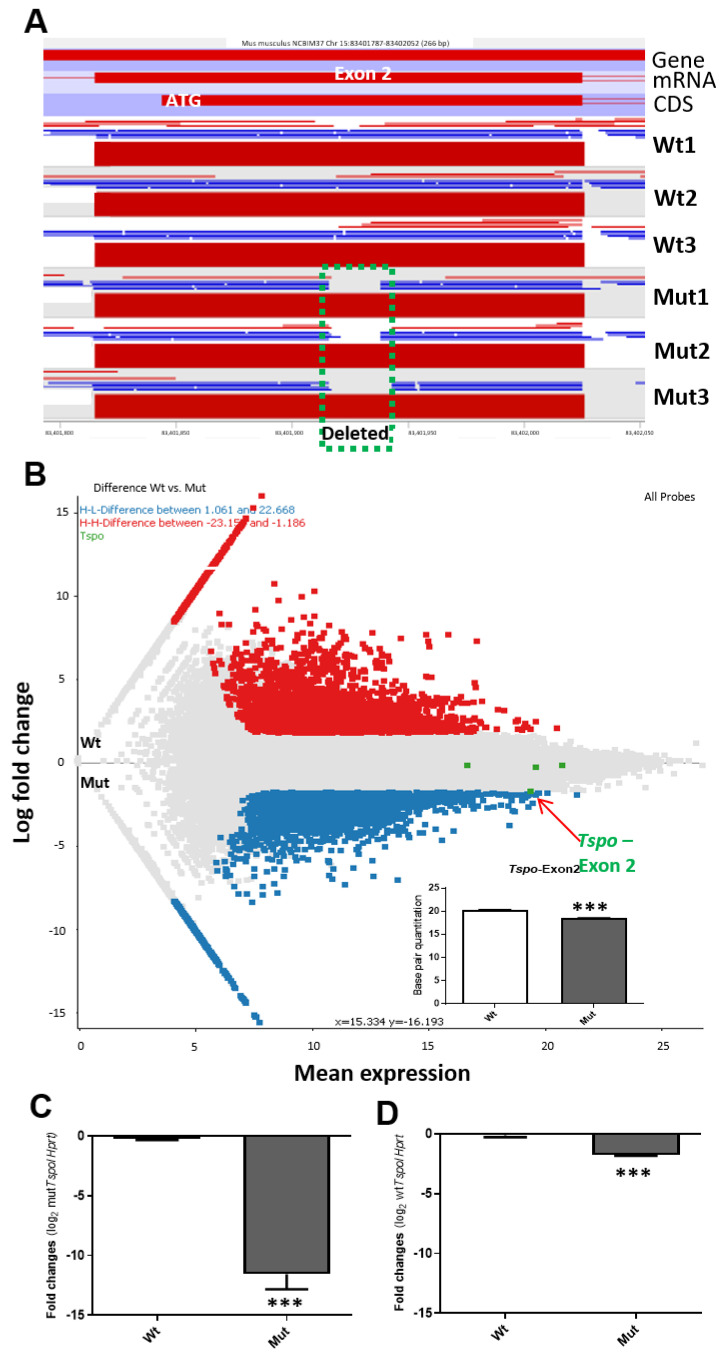
Figure 1.
The genome mapping of Tspo exon2 after CRISPR/Cas9-mediated genome editing and the transcriptome changes under TSPO deficiency. (A). RNA-seq mapping of transcripts onto the Tspo exon 2. Gene, mRNA, CDS (coding sequence), and ATG are indicated. Deleted area is indicated as green square dotted line. Wt1, Wt2 and Wt3: three wild-type cell populations; Mut1, Mut2 and Mut3: three mutated cell line populations. (B). M-A plot of the comparison of RNA-seq data from Wt vs. Mut, by transforming the data differences onto M (log ratio, Y-axis) and A (mean average, x-axis) scales. Each exon of Tspo gene is indicated by green dots: exon2, where there is a small deletion, is indicated and shown to be significantly lower than that in Wt, using base pair quantitation as shown in bar graph. The rest of the exons show no significant differences. Each dot represents each exon; Red dots, highly expressed genes after TSPO depletion and blue dots, the less expressed genes after TSPO depletion; the grey dots are exons showing no dramatic changes between Mut and Wt cells. Inset, base pair quantitation of exon 2 of Tspo gene, which was partially deleted by the CRISPR/Cas9 genome editing. ***, p value < 0.001 (student t-test, n = 3). C–D. Real-time PCR of Tspo Mut transcripts using one of the primers located within the deleted area as shown in A (C) and the rest of the undeleted exon regions (D). ***, p value < 0.001 (student t-test, n = 3).

