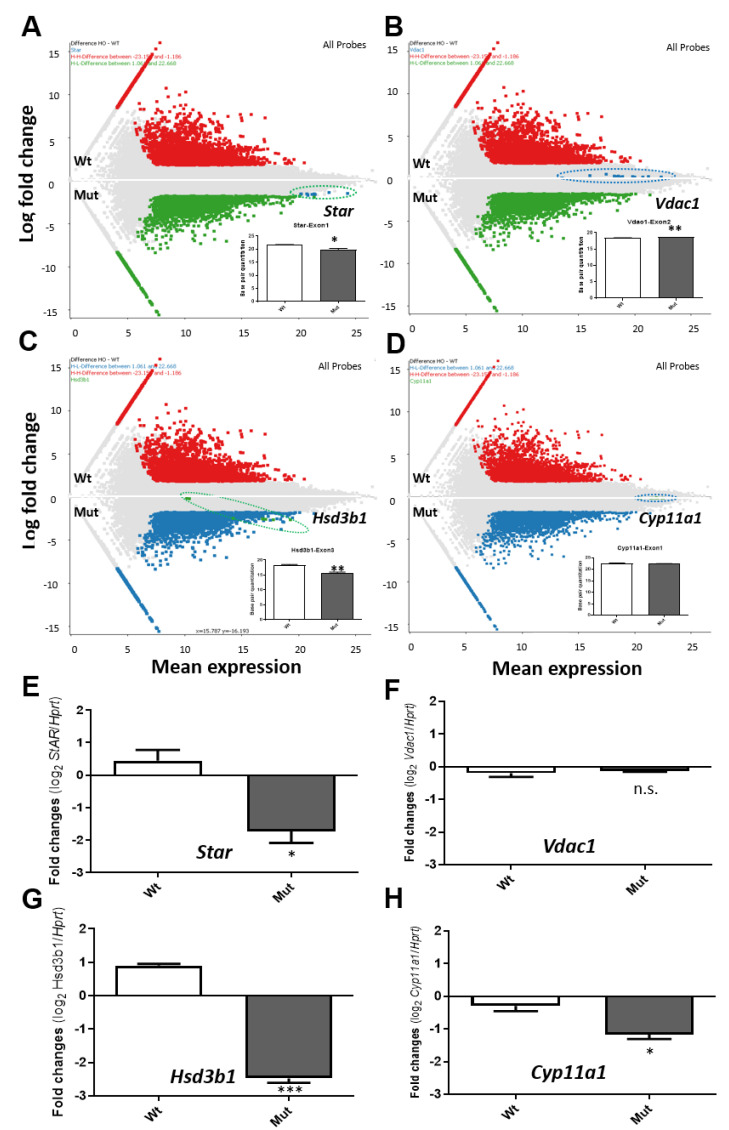
Figure 2.
MA-plots of RNA-Seq data for selected important steroidogenic genes: Star (Stard1), Vdac1, Hsd3b1, and Cyp11a1. (A). Exons of Star are shown as blue dots, and the bar graph shows quantitation of the actual number of bases between Mut versus Wt. (B). Exons of Vdac1 gene are shown as blue dots, and the bar graph shows the quantitation of the base difference between Mut versus Wt. (C). Exon of Hsd3b1 gene are shown as green dots, and the bar graph shows the quantitation of the base difference between Mut versus Wt. (D). Exon of Cyp11a1 gene are shown as green dots, and the bar graph shows the quantitation of the base difference between Mut versus Wt. (E,H). Real-time PCR of the four selected genes as shown in (A–D). Three steroidogenic genes Star, Hsb3b1 and Cyp11a1 are significantly down-regulated, whereas Vdac1 shows no significant change. *, p value < 0.05 (student t-test, n = 3). **, p value < 0.01 (student t-test, n = 3). ***, p value < 0.001 (student t-test, n = 3).

