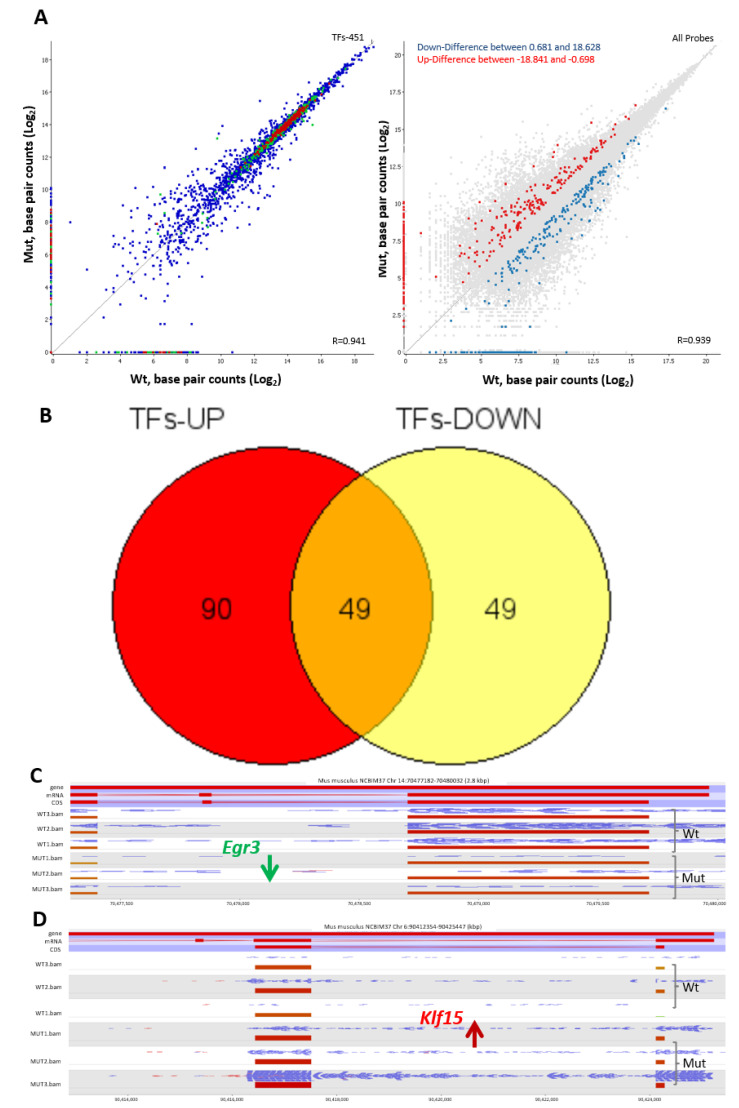
Figure 5.
Transcription factors (TFs) affected by the loss of TSPO. (A). A scatter plot of a total of 451 mouse TFs from HOmo sapiens COmprehensive MOdel COllection (HOCOMOCO; http://hocomoco11.autosome.ru) between Wt vs. Tspo Mut (left) and their highlighted distribution in the total transcriptome changes (right). The color of the dots in the left panel represent TFs showing higher expression (red), reduced expression (green) and no change in expression levels (blue) between Wt and Mut cells. (B). 90 TFs are up-regulated and 49 TFs are down-regulated from a total of 188 TFs dramatically changed by the loss of TSPO. C-D. An example of down- (C) and up (D) regulated genes: Egr3 (early growth response 3) and Klf15 (Kruppel like factor 15), are presented. Egr3 is an immediate-early growth response gene, which is induced by mitogenic stimulation, whereas Klf15 is a negative regulator of TP53 acetylation that inhibits NF-κB activation through repression of EP300-dependent RELA acetylation.

