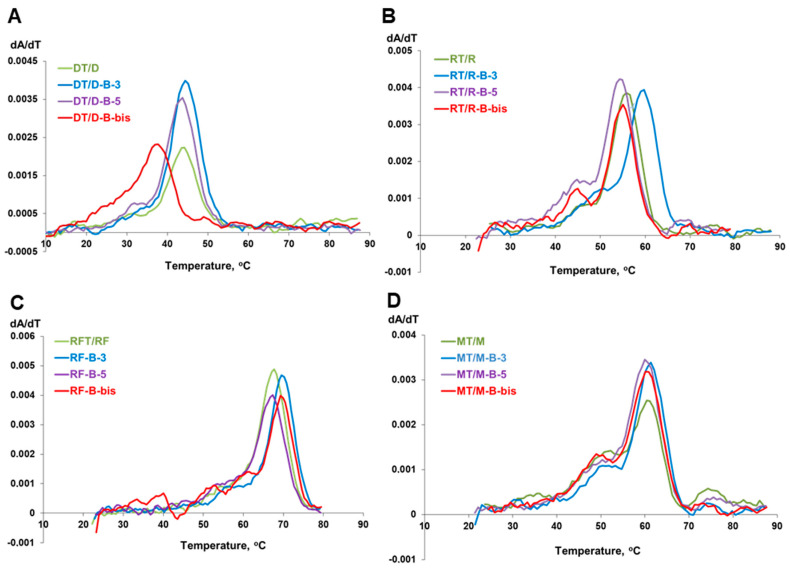
Figure 5.
Melting curves of the duplexes formed by oligonucleotide conjugates with closo-dodecaborates and their complements: DNA (A), RNA (B), 2′-F-RNA (C), and 2′-O-Me-RNA (D). For each panel, green curve—control duplex of parent non-conjugated oligonucleotide, blue curve—duplex of 3′-conjugate, violet curve—duplex of 5′-conjugate, red curve—duplex of dual 3′,5′-conjugate. Conditions: 10 mM sodium phosphate (pH 7.5), 2 µM oligonucleotides.

