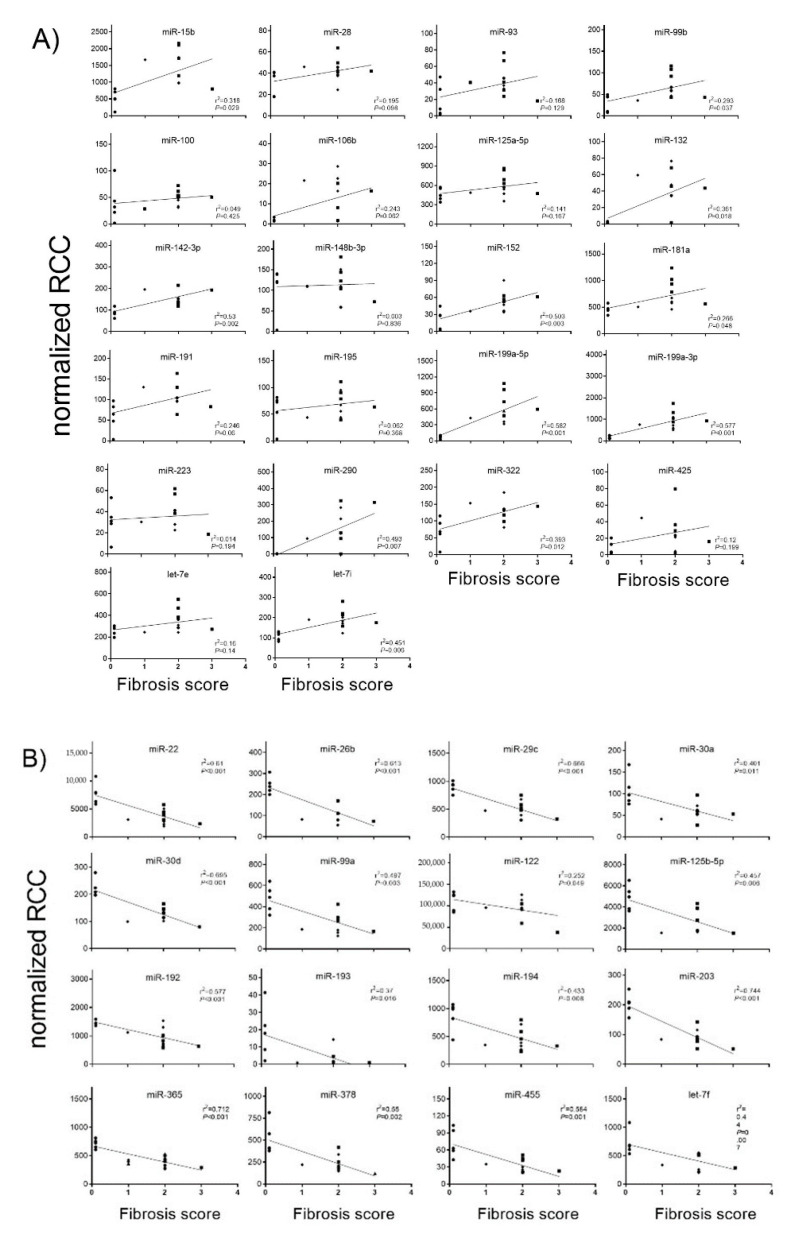
Figure 3.
Correlation of fibrosis scores with up-regulated hepatic (A) and down-regulated (B) miRNA expression. MiRNA levels of control, CCl4/Vehicle and CCl4/PDE5 inhibitor treated rats were correlated with fibrosis scores. Absolute values are displayed for each animal by normalized reporter cell counts (RCC). Spearman’s correlation coefficient and corresponding p-values are indicated.

