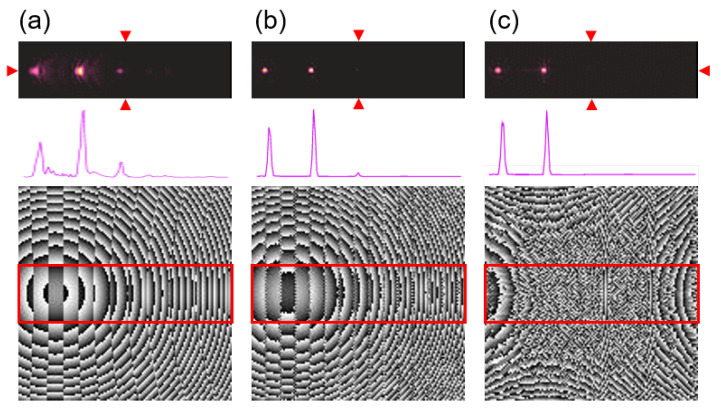
Figure 9.
The comparison of different DOE design methods—(a) theoretical off-axis lens equations with 25 mm and 50 mm shifts, (b) iterative algorithm and (c) neural network optimization of phase distribution. The calculated phase distributions of the diffractive structures are shown as a grey scale image (lower panel) corresponding to introducing phase retardation from 0 (black) to (white). On the upper panel the corresponding reconstructed intensity patterns are given in color palette. The reconstructed area was the same size as the structure, but here was limited to the region marked with red rectangles on phase retardation maps. The cross-sections along the horizontal axis crossing the main optical axis (marked with red triangles) are shown in the middle panel.

