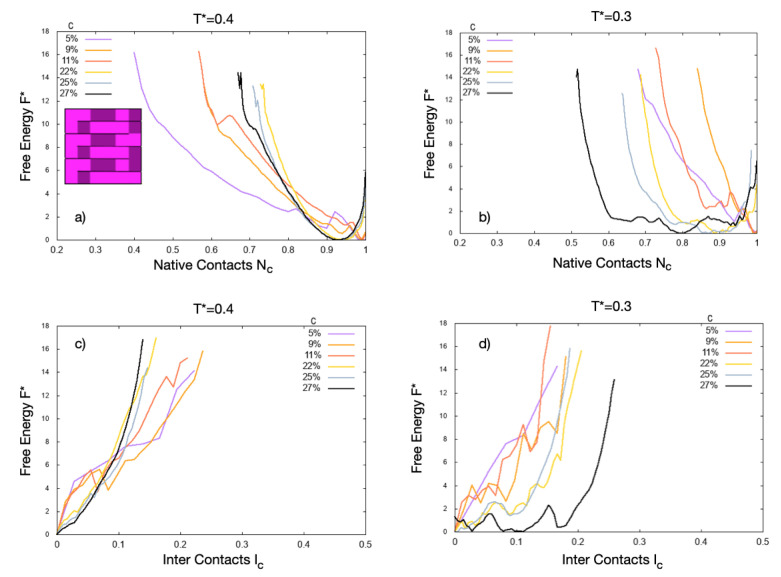
Figure 1.
The snake-proteins free energy changes with concentration c and temperature . The concentrations go from (violet) to (black), as indicated in the legend. (a) Inset: Native structure of the snake protein; the dark/light cells are hydrophobic/hydrophilic amino acids. Main panels: at warm temperature (), and (b) at ambient temperature (), has a minimum that moves from at low c to at high c, with a change between the folded and the unfolded state at , corresponding to proteins in our system. The change is greater at ambient conditions. (c) For warm temperature and the same concentrations, has a minimum always at , showing that the proteins do not aggregate at this temperature, regardless if they are folded or unfolded. (d) The result is different at ambient conditions. The free energy develops several minima at the larger concentration, (12 proteins), showing that the unfolded proteins aggregate at high concentration. In all the panels, the curves at lower concentrations are noisier than those at higher c because the corresponding averages are over smaller numbers of proteins. Hence, the fluctuations along the curves are an indication of the error bar on the estimates. In general, a detailed study of the free-energy landscape to estimate the possible occurrence of free-energy barriers would imply much larger statistics, which is out of the scope of the present work.

