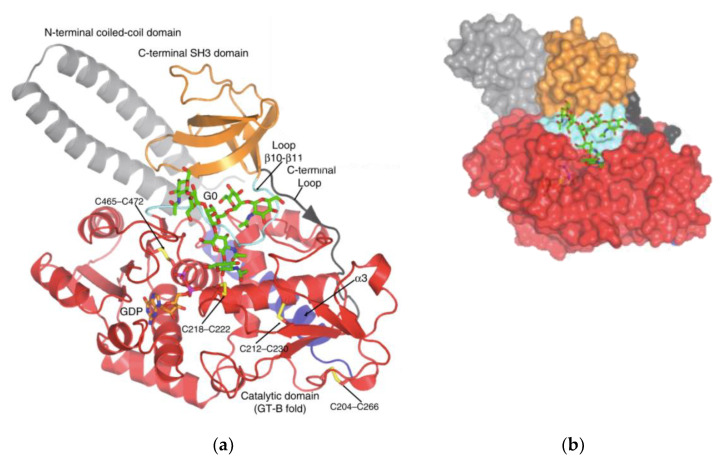
Figure 3.
Structure of FUT8. Published by [43] and reproduced with permission. (a) Ribbon structure of HsFUT8 with orange carbon atoms representing GDP and green carbon atoms representing a bi-antennary complex N-glycan (G0). The coiled-coil domain is colored in gray, the catalytic domain in red, and the SH3 domain in orange. The interdomain α3 and loop β10–β11 are colored in blue and aquamarine, respectively. Yellow sulfur atoms indicate disulfide bridges. The C-terminal loop is colored in black. Electron density maps are FO–FC (blue) contoured at 2.2σ for GDP and G0. (b) Surface representation of the HsFUT8-GDP-G0 complex.

