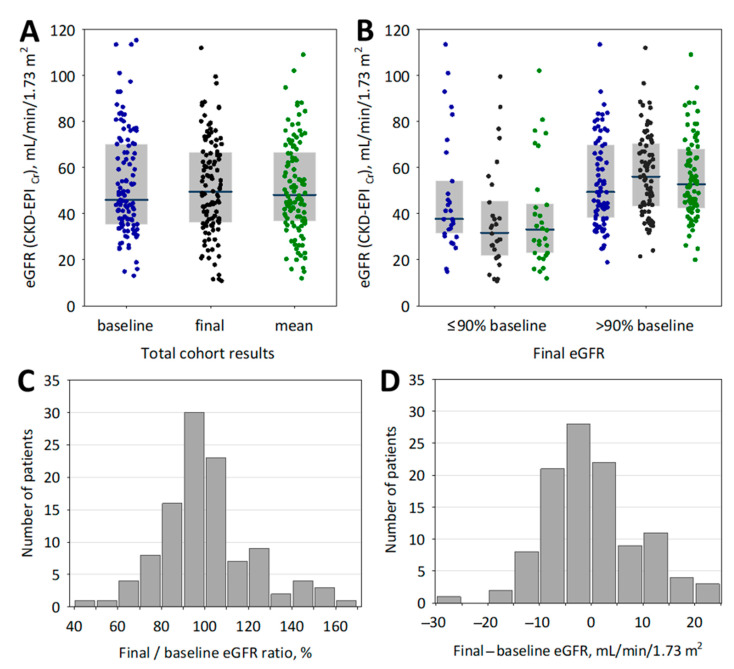
Figure 1.
Baseline (blue points), final (black points) eGFR values and eGFR values based on mean creatinine during follow-up (“mean”; green points) in the whole studied cohort of kidney transplant recipients (A) and in the subgroups defined by final to baseline eGFR ratio below or above 90% of baseline value (B). Data on panels A and B are shown as median (central line), interquartile range (box) and raw data (points). The histograms showing percentage (C) and absolute (D) changes in eGFR values over the follow-up period in the whole studied group of kidney transplant recipients.

