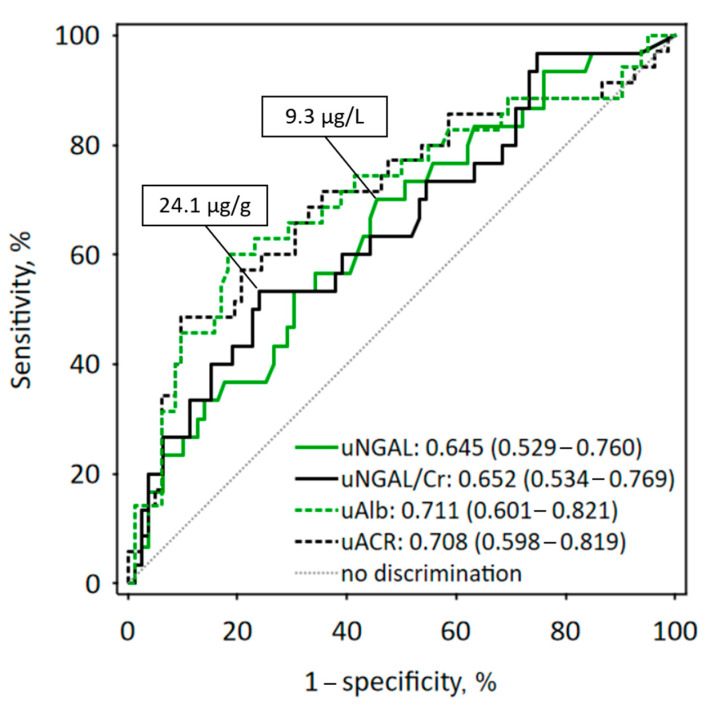
Figure 2.
Receiver operating characteristic (ROC) curves for baseline urine NGAL concentration (uNGAL; solid green line) and urine NGAL/creatinine ratio (uNGAL/Cr; solid black line) in the prediction of ≥10% decrease of eGFR during the one-year follow-up. The cut-off values are reported on the graph. For comparison, ROC curves for urine albumin concentration (uAlb) and urine albumin/creatinine ratio are presented using dashed lines. The values of area under the ROC curves (AUC) are shown with 95% confidence intervals in brackets.

