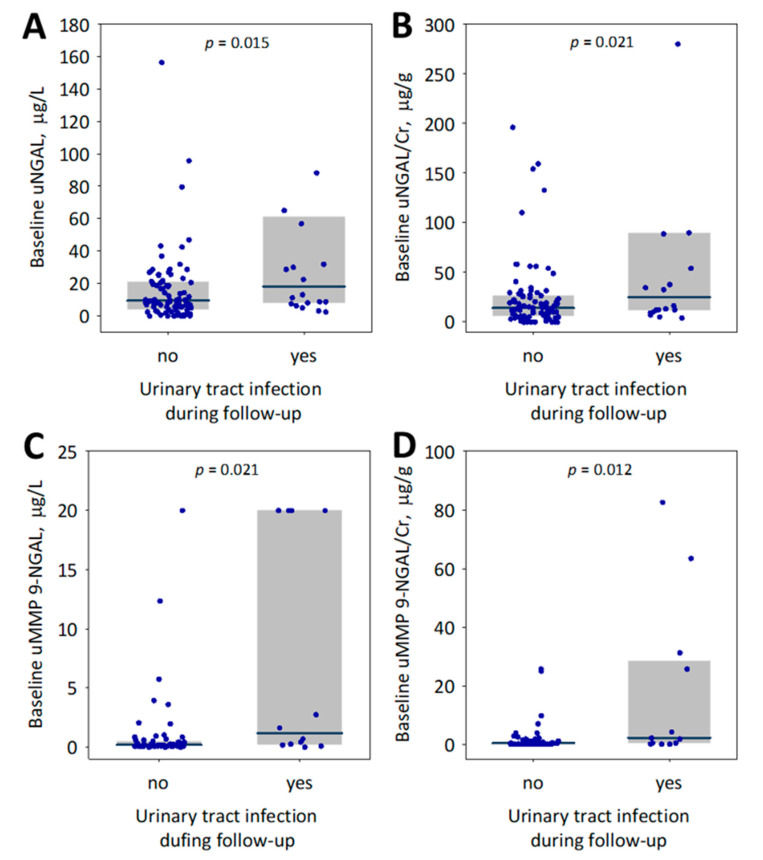
Figure 3.
Baseline urine NGAL concentration (uNGAL; (A)), urine NGAL to creatinine ratio (uNGAL/Cr; (B)), urine MMP 9-NGAL complex concentration (uMMP 9-NGAL; (C)) and urine MMP 9-NGAL complex to creatinine ratio (uMMP 9-NGAL/Cr; (D)) among studied kidney transplant recipients who did or did not experience bacterial urinary tract infections during the follow-up period. Data are shown as median (central line), interquartile range (box) and raw data (points); p-values are given for the differences between groups. To increase readability of the graphs, we omitted the highest results of urine NGAL (528; 1275; 1401 µg/L; panel (A)) and NGAL/creatinine (1251; 1656; 2183 µg/g; panel (B)) obtained in three patients who experienced urinary tract infection during follow-up.

