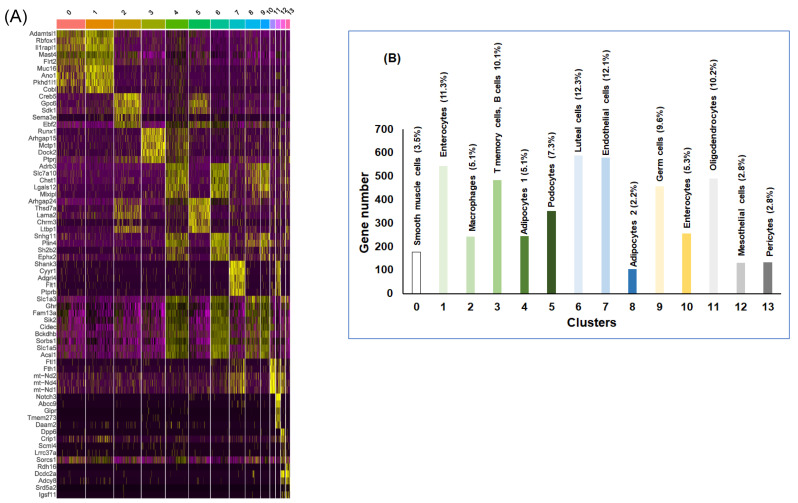
Figure 2.
snRNA-seq for the statistically significant differentially expressed genes (DEGs) in vWAT of mice exposed to RA vs. IH for 6 weeks. (A) Heatmap of the 5 most differentially expressed genes (DEGs) of all 14 cell clusters. Each row of this heatmap is a gene determined to be a marker for one or more clusters, and each column is a cell. The cells are grouped by cluster. Each cell type is represented by the top 5 genes ranked by false discovery rate (FDR) adjusted p-value of a Wilcoxon rank sum test between the average expression per cluster value for each cell type (RA) against the other average subject expression of the other cell types for IH. Each column represents the average expression value for one cell type in RA vs. IH, n = 2/condition. (B) Histogram illustrates the gene number, percentage and cell types per cluster in DEGs in RA and IH. The heatmap shows the upregulated genes (ordered by decreasing p-value) in each cell type and selected enriched genes used for biological identification of each cluster (scale: Log2 fold change). Yellow color indicates the top 5 genes for each cell type.

