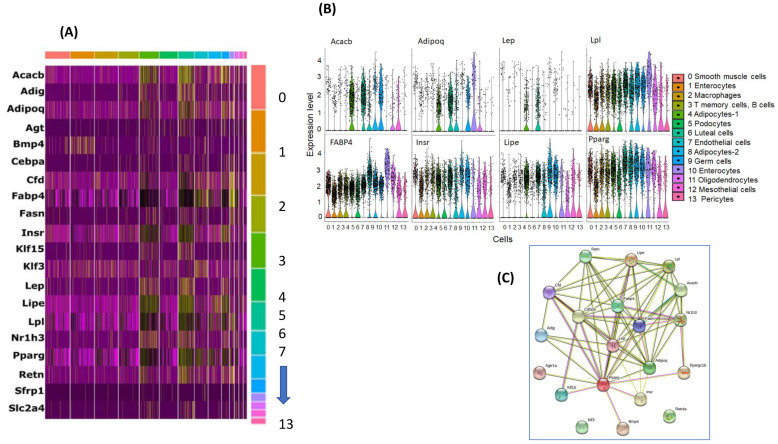
Figure 4.
Selected adipocyte and adipogenesis genes in curated list reported in the literature. (A) Heatmap of the selected gene expression in each snRNA-seq cell type. (B) Violin plots for selected genes and their expression in snRNA-seq in each cell type, assigned by SingleR, using the expression profiles of individual cells. On the x axis, cluster number and y-axis the differentially expressed in RA vs. IH. (C) Gene networks of selected genes expressed in adipocytes and metabolic genes in vWAT of mice exposed to IH compared to RA.

