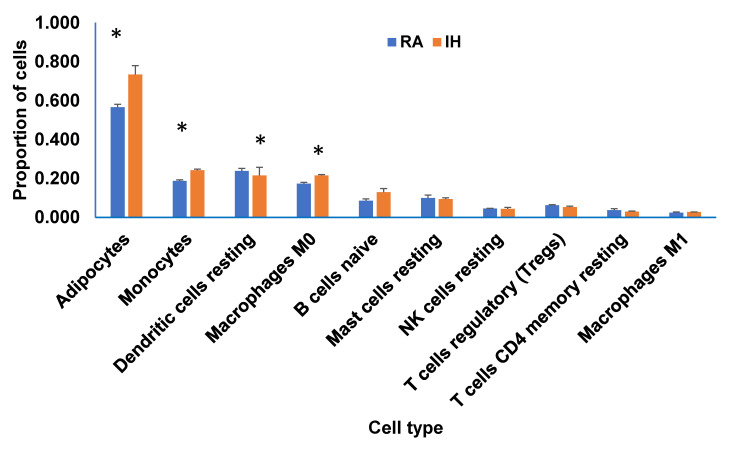
Figure 8.
Deconvolution of bulk RNA-Seq of vWAT in mice exposed to IH compared to RA for 6 weeks. Bar graphs depict the frequency of each cell type in each condition from bulk RNA-seq data, as proportions of total cells inferred from markers of adipocytes; monocytes; dendritic cells resting; macrophages (M0); B cells; naïve; mast cells resting; NK cells resting; T cells regulatory (Tregs); T cells CD4; memory resting; and macrophages M1. Y-axis indicates the estimation of cell subtype proportion fraction of each cell type, X-axis indicates cell types. A comparison of decomposition estimates 547 genes from mouse immune system and 712 of mouse adipocytes as described in the Methods.

