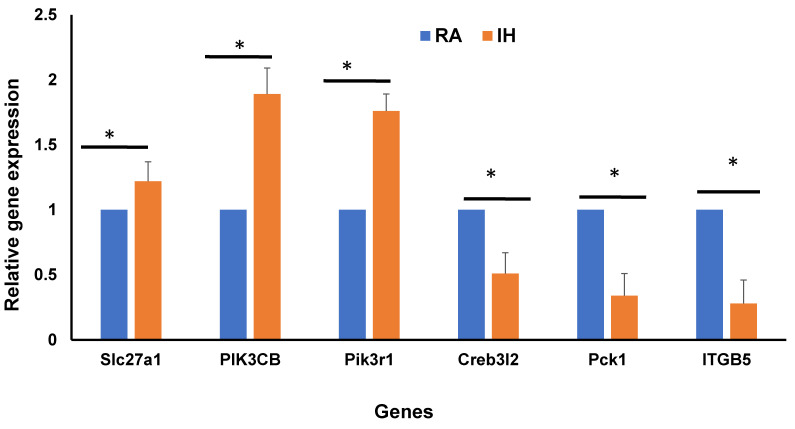
Figure 9.
Validation of differentially expressed genes in bulk RNA-seq and snRNA-seq clusters involved in insulin resistance using qRT-PCR as shown in Venn diagram (Figure 7A). Total RNA was isolated from vWAT and analyzed by qRT-PCR analysis for 6 genes (3 upregulated and 3 downregulated). qPCR data were normalized to β-actin as an internal control. Data are presented as mean ± SD; n = 4/experimental condition; * indicates a significant difference at the p < 0.05 level. n = 4/condition.

