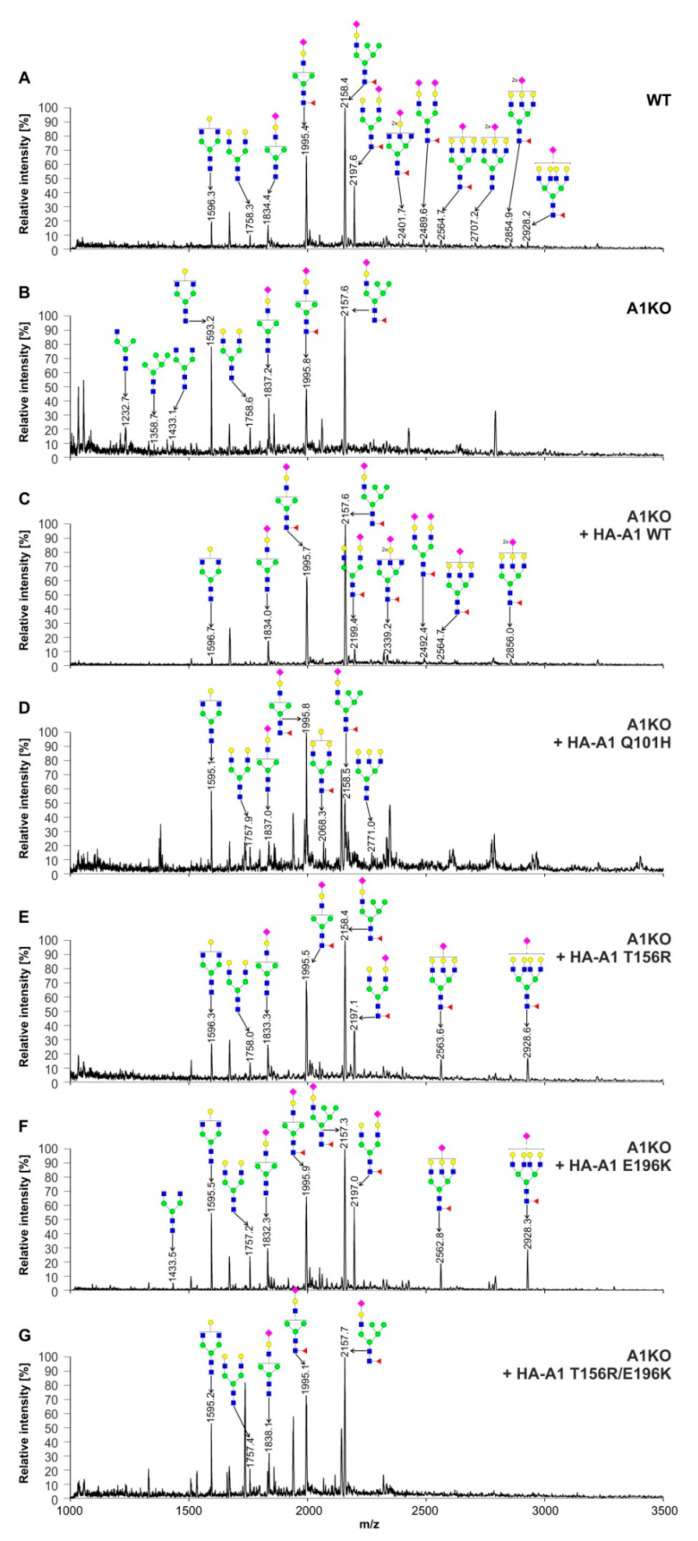
Figure 7.
Structural analysis of N-glycans. MALDI-TOF MS characterization of 2-AB-labeled N-glycans released from cellular glycoproteins produced by the wild-type HEK293T cells (WT) (A), CST-deficient cells (B), CST-deficient cells expressing wild-type CST (C), CST-deficient cells expressing the Q101H CST variant (D), CST-deficient cells expressing the T156R CST variant (E), CST-deficient cells expressing the E196K CST variant (F) and CST-deficient cells expressing the T156R/E196K CST variant (G). N-Glycan composition was estimated using the GlycoWorkBench tool (2.1; EuroCarbDB). Identified peaks were labeled with mass information and cartoon representations of putative N-glycan chemical structures (based on biosynthetic knowledge). Green circles, mannose; blue squares, N-acetylglucosamine; yellow circles, galactose; red triangles, fucose; pink diamonds, sialic acid. A1, SLC35A1.

