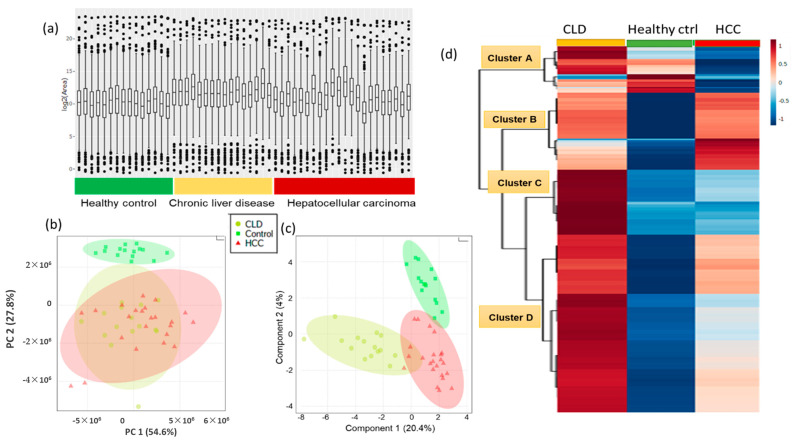
Figure 2.
Multivariate and univariate statistical analyses of identified blood lipids in whole in hepatocellular carcinoma (HCC) and chronic liver disease (CLD) patients, and healthy control subjects. (a) Distribution of total ion concentrations (TIC) of all lipids for each subject, organized by subject groups. (b) Unsupervised principal components analysis (PCA) separating lipid profiles of HCC, CLD and healthy control groups. (c) Supervised sparse partial least squares discriminant analysis (sPLSDA) separating lipid profiles of HCC, CLD and healthy control groups. (d) Hierarchical clustering heatmap of 524 significant lipids after univariate Kruskal–Wallis tests (p < 0.05 with qFDR < 0.1). Columns represent lipidomic averages of each subject group. Levels of individual lipid average intensities colored by auto-scaling from high (red) to blue (low) levels.

