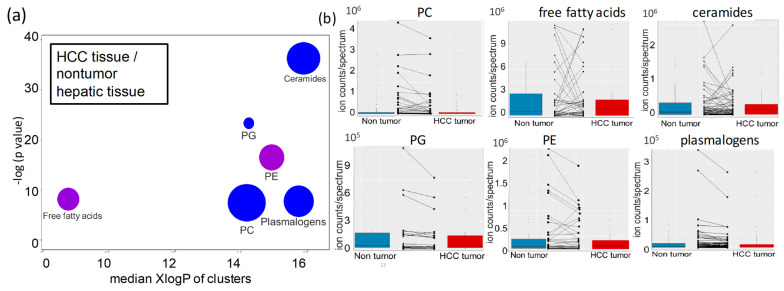
Figure 5.
Lipid set enrichment statistics in HCC hepatic tissues versus nontumor hepatic tissues (a) ChemRICH plot. Bubble colors range from blue (decreased) to purple, indicating increased and decreased lipid species in lipid classes. Bubble size represents the number of compounds per lipid class. Lipid classes are ordered by median lipophilicity (XlogP) along the x-axis. (b) Boxplots of paired comparisons of significant lipid classes in HCC tumors versus nontumor hepatic tissues, including directions of change for individual lipid species in these classes. Abbreviations as in Figure 1.

