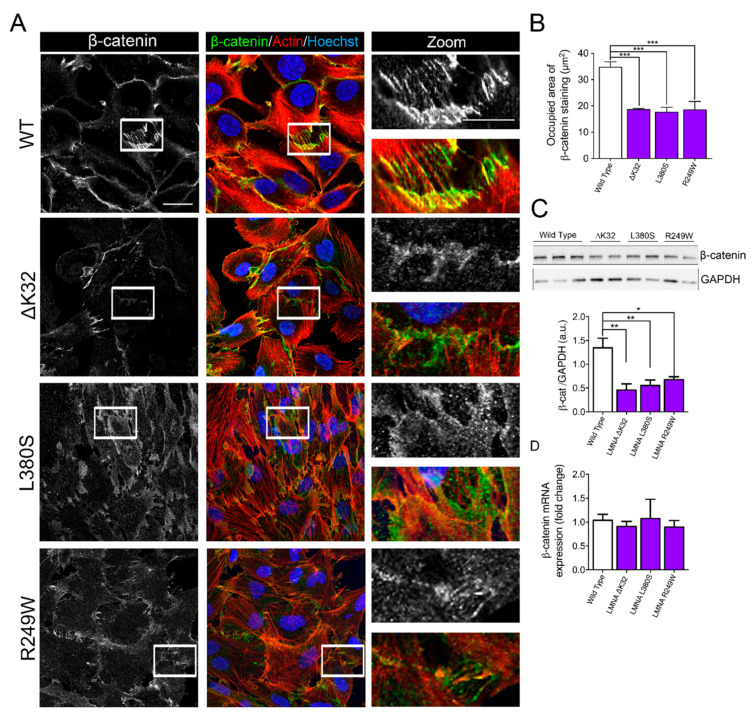
Figure 3.
β-catenin in WT and mutant muscle cell precursors. (A). Confocal immunofluorescence images of F-actin (phalloidin, red) and β-catenin (white or green) in wild-type and LMNA mutant (ΔK32, L380S and R249W) mutant myogenic cell precursors. Nuclei are stained with Hoechst (blue). Scale bar: 20 µm. Zoomed region of cell-cell junctions are shown in left panels. Scale bar: 10 µm. (B). Quantification of the occupied area of β-catenin staining at cell-cell junctions. Pooled values of WT (WT1 and WT2) are presented. Values are means ± SEM from at least 4 different images/cell lines. *** p < 0.001 compared with WT. (C) Top: Representative Western blot of β-catenin and GAPDH in WT and mutant myoblasts. Bottom: Quantification of β-catenin protein levels expressed in arbitrary units (a.u.). GAPDH was used as a loading control. Pooled values of WT (WT1 and WT2) are presented. Values are means ± SEM, n ≥ 3 from at least 2 separate experiments. * p < 0.05, ** p < 0.01 compared with WT. (D) Relative mRNA expression of β-catenin (β-cat) normalized to RPLP0 and expressed as fold-changes. Pooled values of WT (WT1 and WT2) are presented. Values are means ± SEM, n = 3 separate experiments. There was no significant difference between cell lines.

