Figure 7.
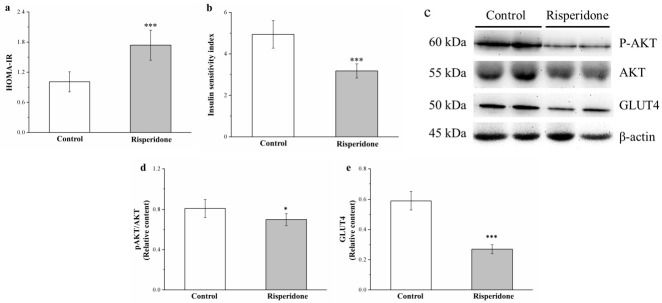
Changes in (a) homeostatic model assessment for insulin resistance (HOMA-IR) and (b) insulin sensitivity (IS) indices, (c) a representative blot of muscle extracts, (d) Akt phosphorylation, and (e) glucose transporter 4 (GLUT4) expression in the gastrocnemius muscle in the control and 1 mg/kg/day risperidone-treated mice over the period of 56 days. All data for both groups are presented as means ± standard deviation (n = 10). * p < 0.05, *** p < 0.001.

