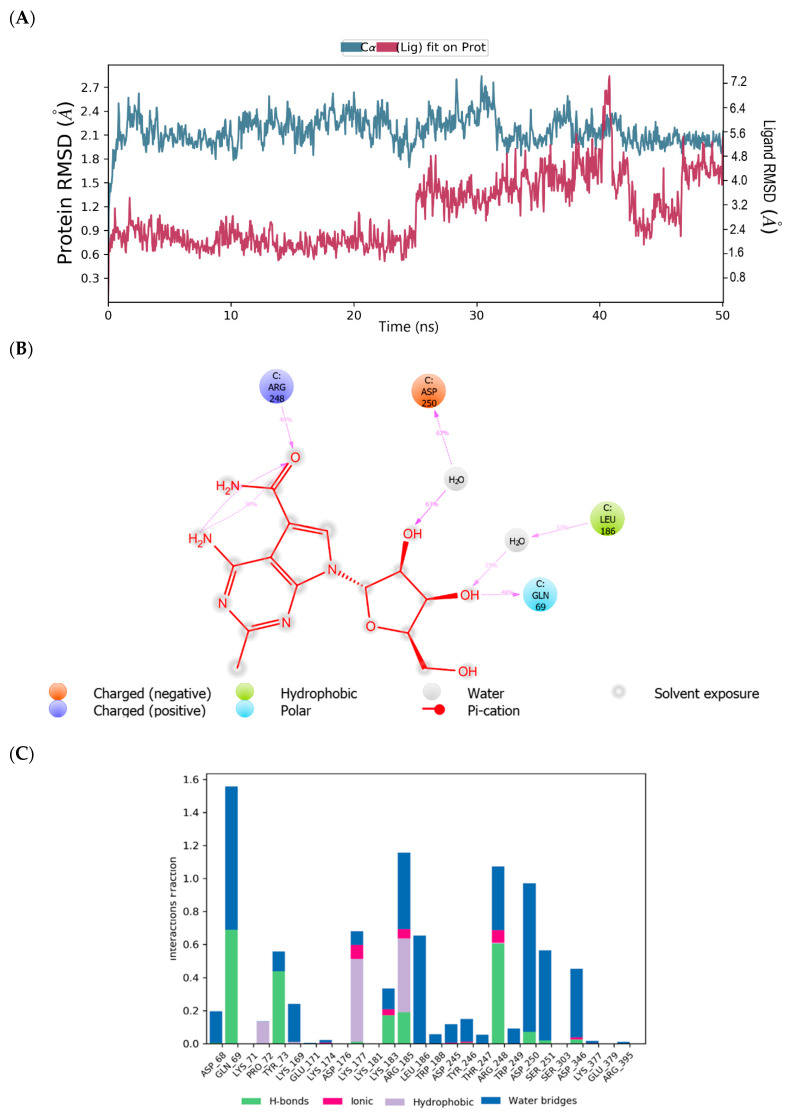
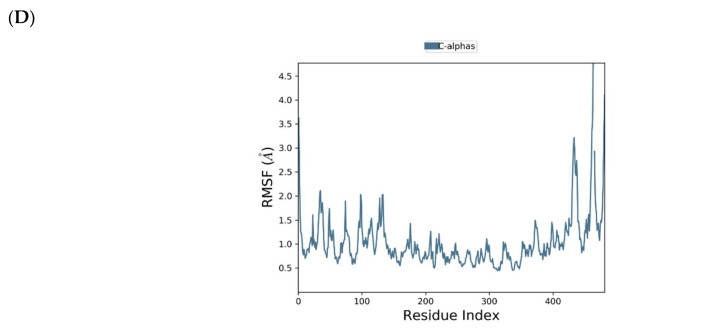
Figure 5.
(A) MDSs trajectory output revealing the root-mean-square deviation (RMSD) plot of CMX521 bound to MNV RdRp; (B) Binding interaction of CMX521-MNVRdRp after MDSs; (C) Ligplot representing interaction of CMX521 with different residues of MNV RdRp throughout the simulation trajectory (D) Graphical depiction of root-mean-square fluctuation (RMSF) of CMX521 with different residues of MNV RdRp.


