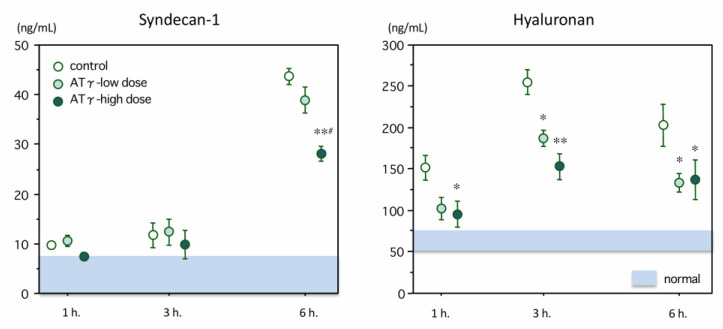
Figure 4.
Changes in plasma levels of syndecan-1 and hyaluronan. Left: The syndecan-1 level was elevated at 6 h after lipopolysaccharide administration. The syndecan-1 level in the high-dose AT-γ group was significantly lower than that in the control group (n = 7 in each group). Right: The plasma level of hyaluronan peaked at 3 h after lipopolysaccharide administration. The hyaluronan levels were significantly suppressed in the AT-γ groups. * p < 0.05 compared with the control group, ** p < 0.01 compared with the control group, # p < 0.05 compared with the low-dose group.

