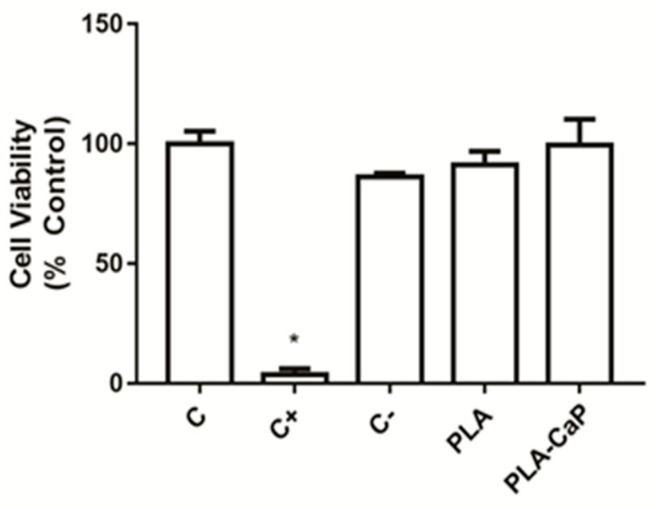
Figure 6.
Cytocompatibility evaluation of the scaffolds, as evaluated by XTT assay. Bars indicate mean ± SD results normalized as a percentage of the unexposed control group (C). Extracts of polystyrene beads were used as negative control (C−) and fragments of latex as a positive control (C+). An asterisk indicates a significant difference with all other groups (p < 0.05).

