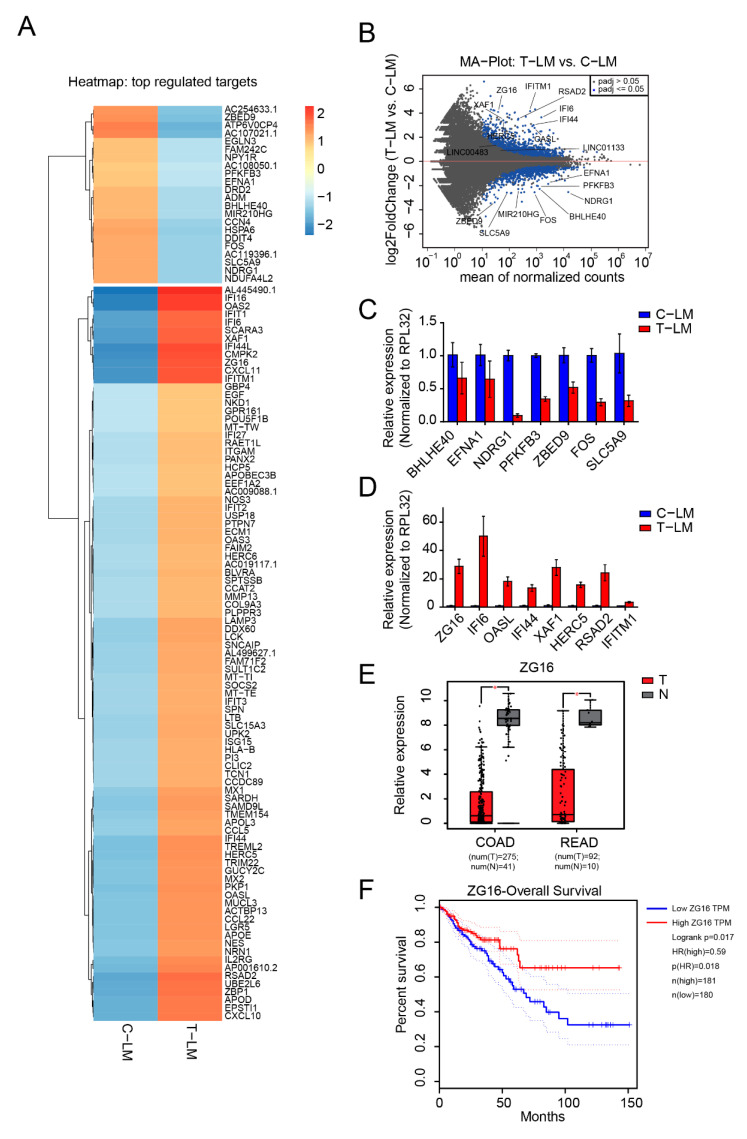
Figure 2.
Identification of mRNAs regulated during LDM topotecan chemotherapy. (A) Heatmap of differentially expressed mRNAs in liver metastases from treated mice (T-LM) versus liver metastases from control mice (C-LM). (B) MA plot of mRNA expression in liver metastases from treated mice (T-LM) versus liver metastases from control mice (C-LM). (C,D) Validation of downregulated and upregulated mRNA from treated liver metastases compared to control liver metastases by qPCR. (E) Boxplot showing the significant downregulation of ZG16 in colon adenocarcinoma (COAD) and rectum adenocarcinoma (READ) obtained from TCGA data, T: Tumors, N: Normal tissues. (F) Survival plot presents patient survival with expression of ZG16. The data from (E,F) was obtained from Gene Expression Profiling Interactive Analysis GEPIA web server [63].

