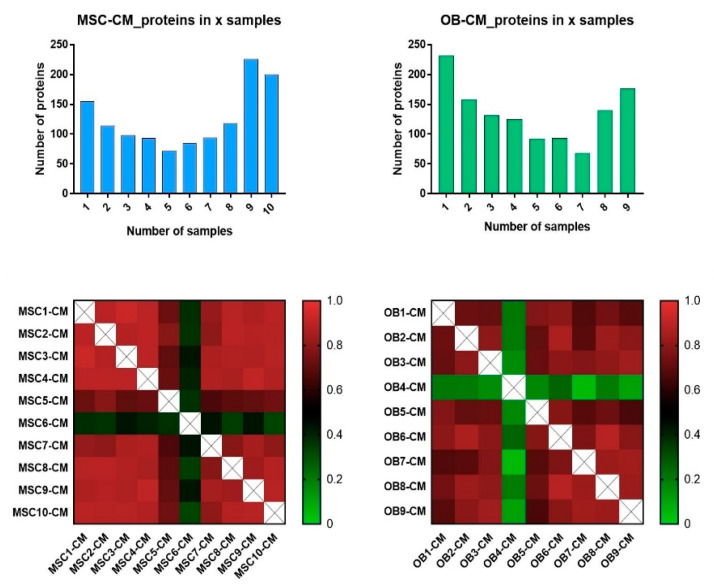
Figure 1.
The constitutive protein release by normal MSCs and osteoblasts; a qualitative proteomic comparison of the various MSCs (10 donors) and osteoblast donors (OB, nine donors). Cells were cultured in serum-free medium for 48 h before supernatants were harvested and the protein levels analyzed in the culture supernatants. The upper two bar plots show the number of proteins (y-axis) that could be quantified for only one donor and up to all ten/nine donors/samples, (x-axis) for the MSCs (upper left) and osteoblasts (upper right). The lower part of the figure shows Pearson correlation plots based on the proteins that could be quantified for at least five donors/samples when analyzing the 10 MSC donors (lower left) and nine osteoblast donors (lower right).

