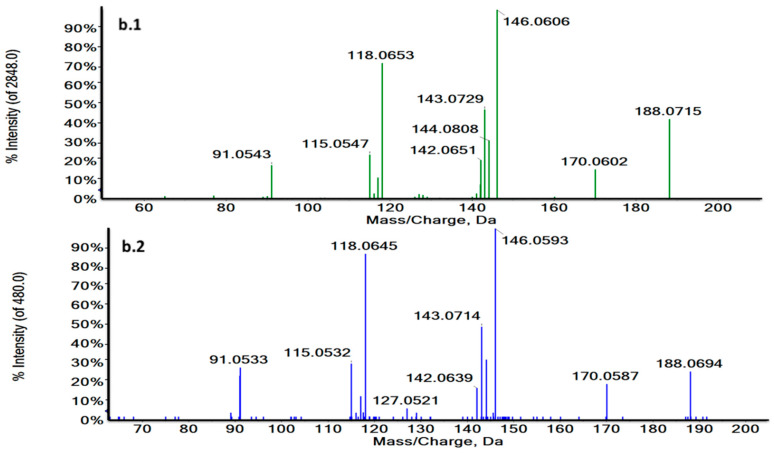
Figure 4.
Characteristic MS/MS spectra of m/z 188.0707 in a biological sample (green) (a.1) and the L-Tryptophan standard at 3.73 min in ESI + (blue) (a.2) and m/z 203.0824 at 1.27 min in a biological sample (green) (b.1) and the L-Tryptophan standard in ESI− (blue) (b.2). MS/MS spectra revealed the characteristic fragmentation pattern of L-Tryptophan both in ESI+ and ESI−.


