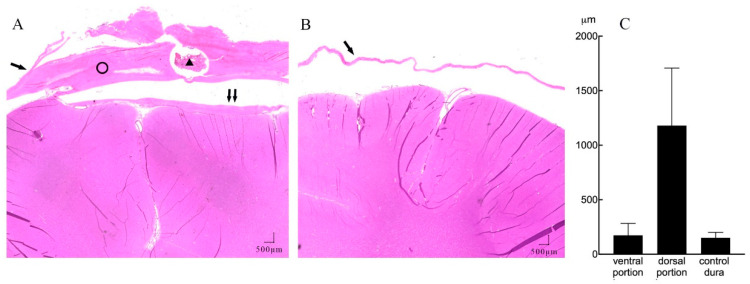
Figure 4.
A representative example of subdural reactions surrounding the ECoG array (HE staining, 20 × magnification). (A) Coronal section of the implant site showing mechanical compression of the cortical tissue, with minimal reactive tissue under the electrode (↑↑) and thick fibrosis between the implanted electrode array and dura membrane (ring). There is a section of the lumen of the leads (triangle) lying inside the dorsal portion of the tissue. (B) Contralateral hemisphere with normal dura membrane (↑) and normal brain tissue. (C) Mean thickness of the dorsal, ventral encapsulation, and control dural membrane.

