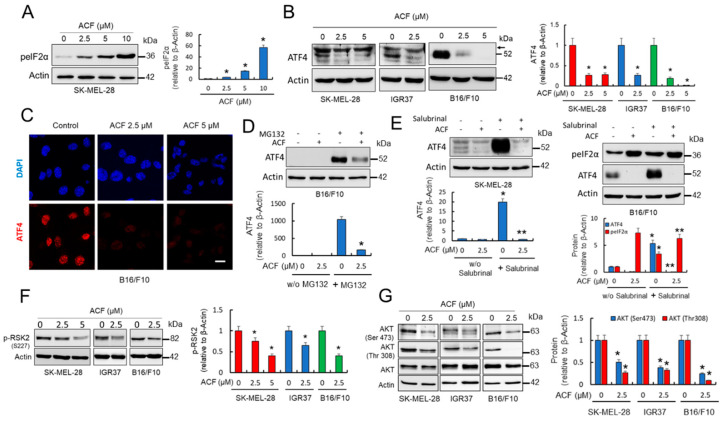
Figure 4.
ACF compromises ATF4 protein stability in melanoma cells. (A) Effect of ACF (24 h) on p-eIF2α expression in SK-MEL-28 melanoma cells analyzed by western blot. IOD quantification is shown (histogram; * p < 0.05 when compared with untreated control). (B) Western blot analysis of ATF4 in melanoma cells under indicated conditions (cells were treated with ACF for 24 h). Histogram represents ATF4 protein levels (detected as a band at 52 kDa) estimated by IOD in western blots after normalization to the β-actin IOD. The values represent the mean from two experiments performed in triplicate. * p < 0.05 when compared with ACF-untreated control experiments. Arrow indicates a nonspecific band observed in human samples at 58 kDa. (C) Confocal microscopy analysis (63X magnification) of ATF4 in control B16/F10 cells and those subjected to indicated ACF (24 h) treatments (bars, 27 μM). (D) Western blot experiments for the effect of ACF (2.5 µM) on ATF4 expression in the absence or the presence of MG132 (10 µM). SK-MEL-28 cells were treated for 12 h with ACF alone or simultaneously co-treated with ACF and MG132. MG132 significantly increased ATF4 in ACF-treated cells (* p < 0.05). (E) Western blot experiments for the effect of ACF (2.5 µM) on ATF4 expression in the absence or the presence of salubrinal (20 µM). Melanoma cells were treated during 24 h with ACF alone or simultaneously co-treated with ACF and salubrinal. As observed, ACF impedes ATF4 stabilization under forced stabilization of p-eIF2α * p < 0.05 and ** not significant when compared salubrinal treatments with their respective treatments without salubrinal (w/o salubrinal). (F) Effect of ACF (24 h) on the phosphorylation of RSK2 (p-RSK2) in melanoma cells analyzed by western blot. p-RSK2 (histogram) was estimated by integrated optical density (IOD) in western blots after normalization to the β-actin IOD. The values represent the mean from two experiments performed in triplicate. * p < 0.05 when compared with the ACF-untreated control experiments. (G) AKT phosphorylation was examined in melanoma cell extracts and compared with the expression levels of total AKT and β-actin. IOD quantification is shown (histogram; * p < 0.05 when compared with their respective untreated controls).

