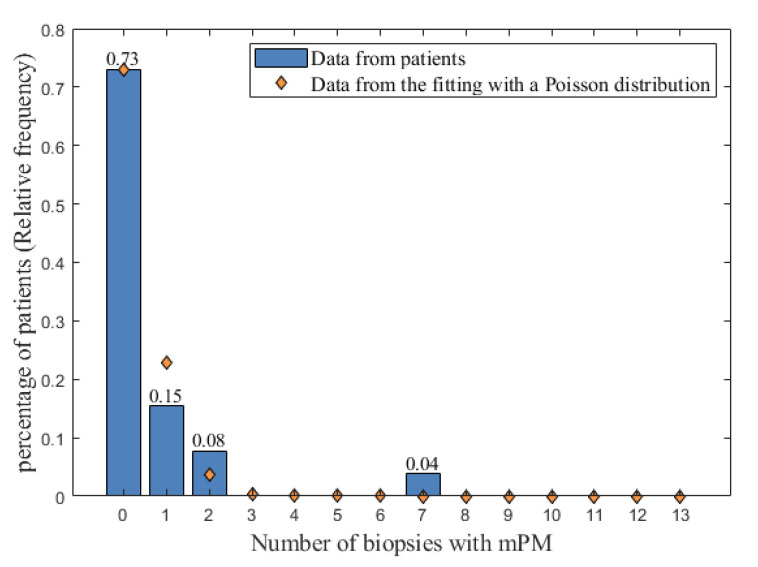
Figure 2.
The relative histogram of the number of biopsies with mPM (blue bars) fitted with a Poisson distribution (orange diamonds). The possible values for the number of biopsies with mPM are reported on the x-axis, and the relative frequency of occurrences of these possible values are represented by blue bars on the y-axis. mPM: microscopic peritoneal metastases.

