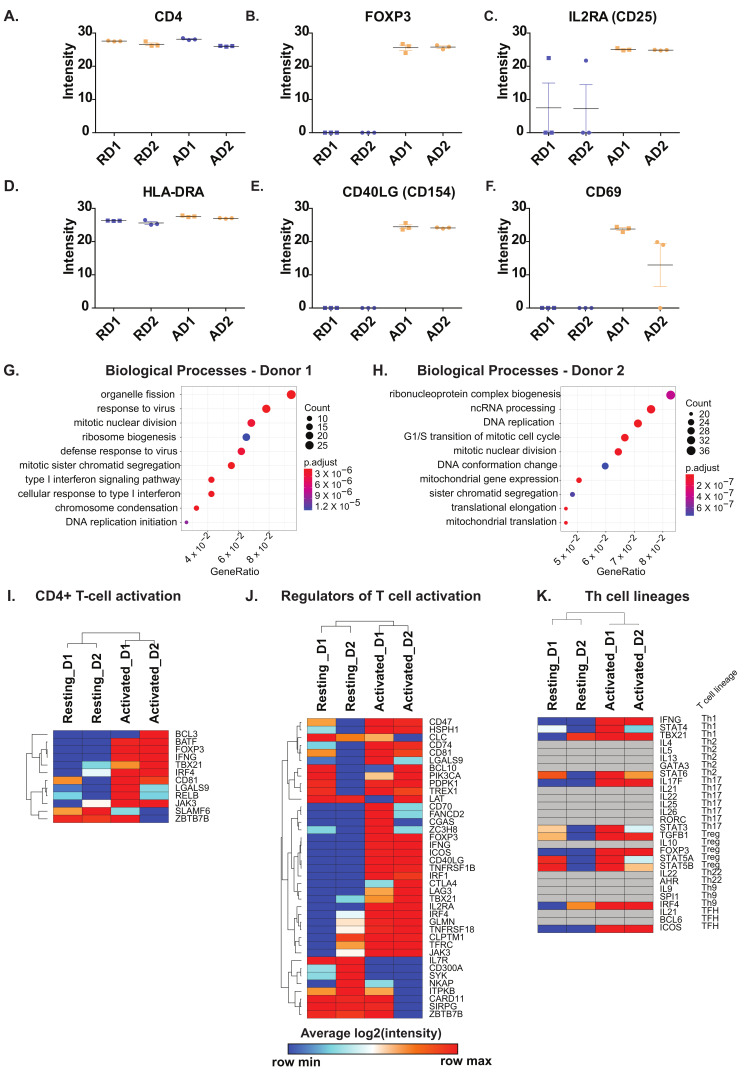
Figure 2.
Protein expression levels of (A) CD4 (B) FOXP3 (C) IL2RA (CD25), (D) HLA-DRA, (E) CD40LG, (F) CD69 in resting (R) and activated (A) primary CD4+ T cells from Donor1 (D1) and Donor2 (D2). Enriched Biological Processes from proteins upregulated in (G) Donor 1 and (H) Donor 2 in response to activation. Heatmaps depicting (I) CD4+ T cell activation markers, (J) Regulators of T cell activation in CD4+ T cells and (K) Markers of T cell lineages. Genesets for comparison of significantly changing proteins were obtained from MSigDB.

