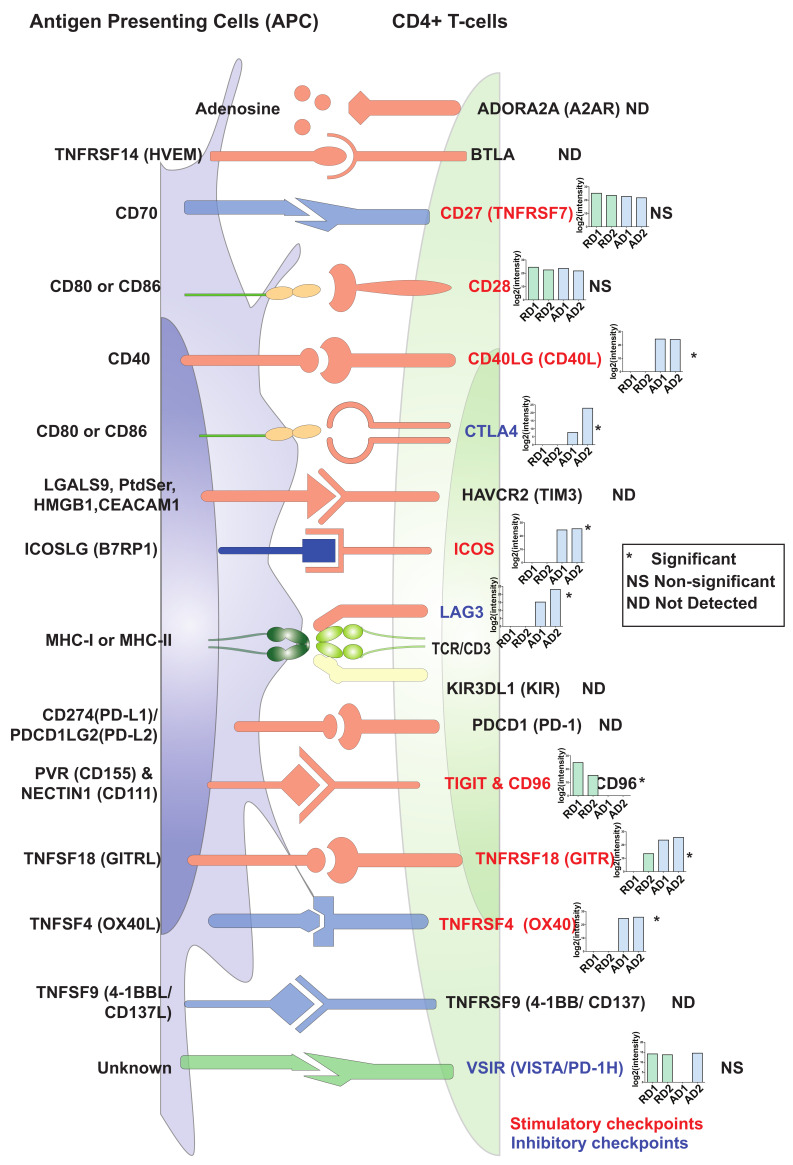
Figure 5.
An illustration representing expression profiles of immune checkpoint regulators in resting and activated primary CD4+ T cells. The inset graphs for each protein provide log2(intensity) value-based abundances for resting (R) and CD3/CD28-activated (A) CD4+ T cells from Donor1 (D1) and Donor2 (D2). Legends indicate Significant (*, FDR ≤ 0.05), Not significant (NS), Not detected (ND).

