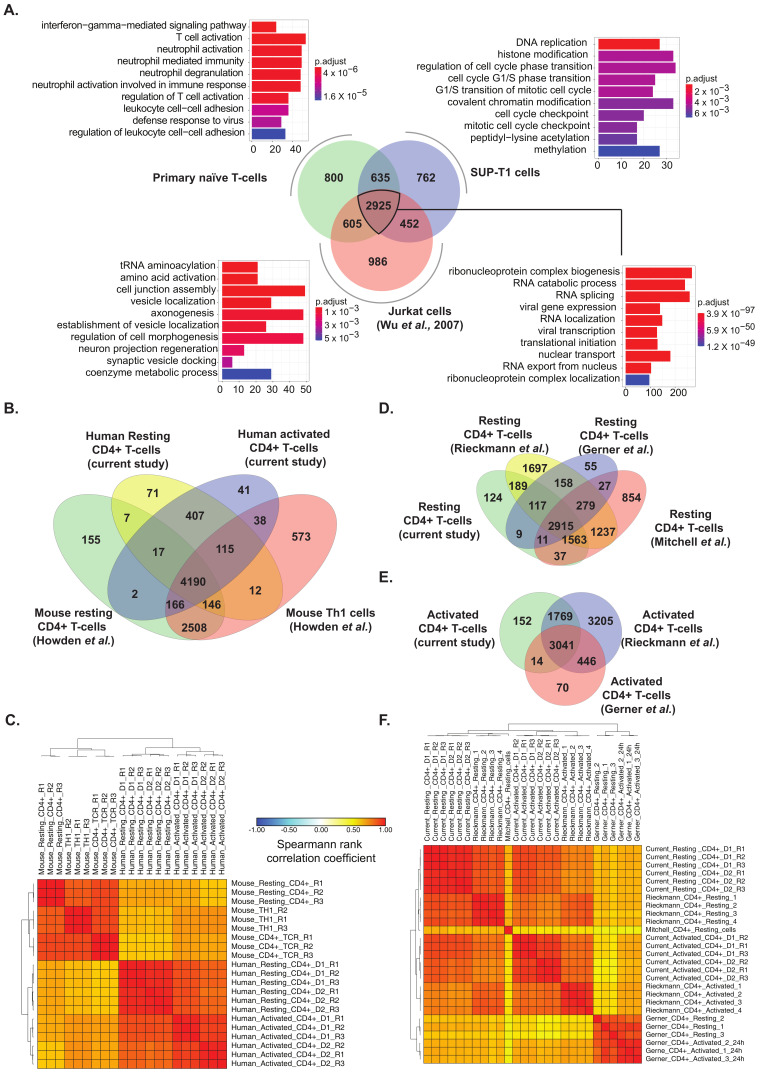
Figure 6.
(A) Comparison between proteomic profiles of primary resting CD4+ T cells, SUP-T1 cells and Jurkat cells (Wu et al., 2007) and Gene ontology-based classification of biological processes of common proteins and proteins distinct to each cell type (B) Comparison of identified proteins and (C). Correlation matrix between previously published dataset on mouse (Howden et al.) and human CD4+ T cells (current study). Comparison of lists of identified proteins with previous studies on (D) Resting and (E) Activated human CD4+ T cells. (F) Correlation matrix for proteomic profiles of resting and activated CD4+ T cells from the current study, and previously published studies including Rieckmann et al., Gerner et al., and Mitchell et al.

