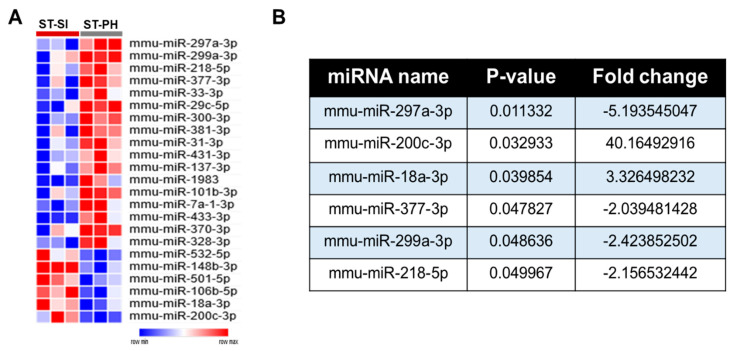
Figure 3.
SI after stroke induces significant changes in brain miRNA profiles compared to PH. (A) 17 significantly upregulated and 6 downregulated miRNAs in the PH group compared to SI mice were identified and plotted as a heat map. (B) Further miRNAome analysis, based on the p value of p < 0.05 and a minimum fold change of 2 or higher, allowed us to identify the differentially regulated brain miRNAs between SI and PH stroke groups.

