Figure 1.
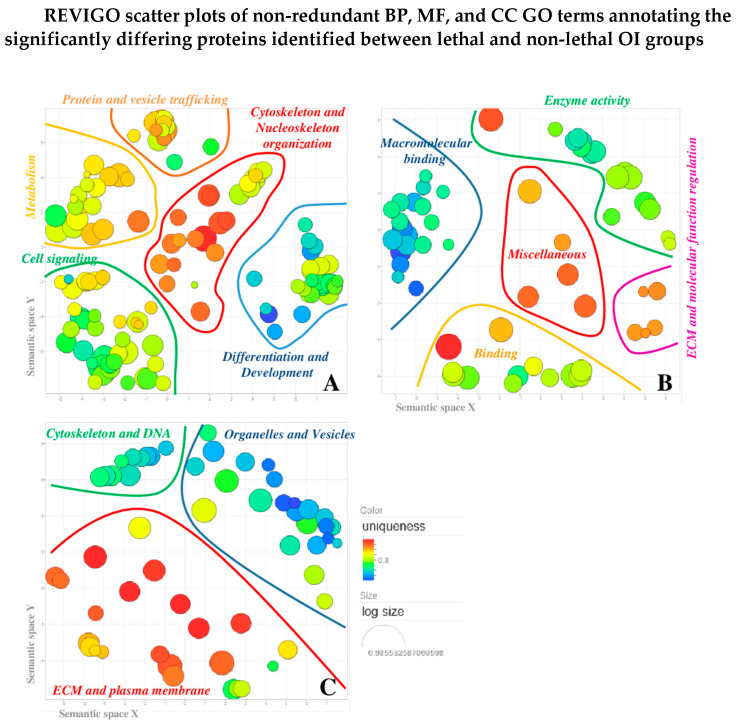
REVIGO scatter plots of non-redundant Gene Ontology (GO) terms annotating the 17 differentially abundant proteins identified between lethal and non-lethal OI groups. Individual plots were built for the three ontologies: biological process (A), molecular function (B), and cellular component (C). Each bubble represents a summarized GO term and the more semantically similar are closer in the plot. The main resulting clusters were graphically highlighted by curved lines. GO terms that were significantly over- or under-represented (GO annotation uniqueness) in the GO list were highlighted by bubble color: from brilliant red, for common shared terms, to dark blue for unique individual terms. Bubble size indicated the frequency of individual GO term in the GO annotation (GOA) referring database (SwissProt): larger the radius, higher in hierarchy is the corresponding GO term.

