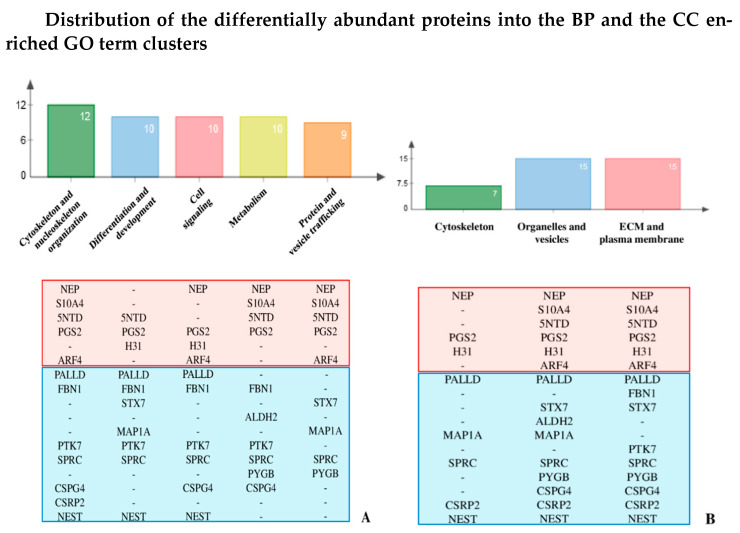
Figure 2.
Distribution of the differentially abundant proteins into the BP (A) and the CC (B) enriched GO term clusters - enrichment analysis results were improved by literature text mining. The number reported in each bar indicates the proteins, whose acronyms are listed below histograms, included in the corresponding cluster. Proteins in the light-red area resulted down-regulated while those in the light-blue area were found up-regulated in lethal probands.

