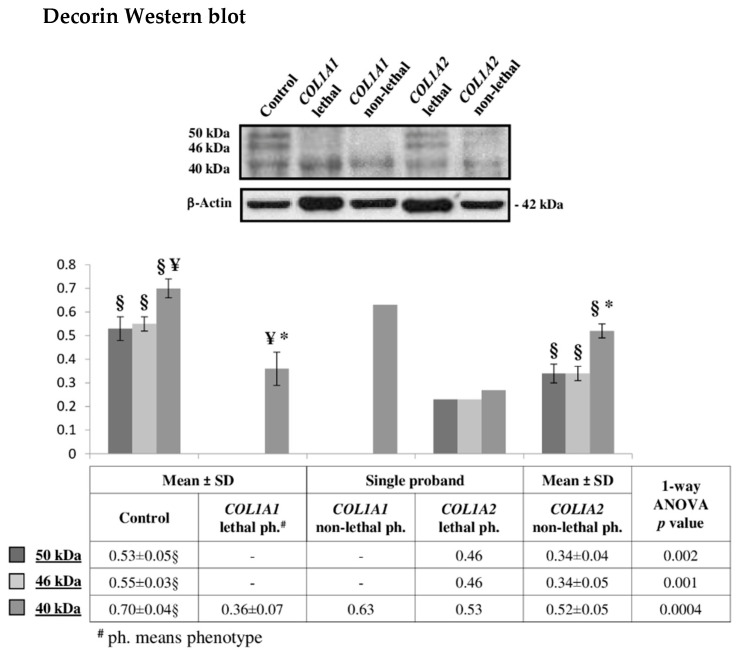
Figure 5.
Representative decorin Western blot on fibroblasts from dominant OI patients carrying lethal or non-lethal mutations in COL1A1 or in COL1A2 genes. The shown signals of immunostained bands from controls, COL1A1 lethal, and COL1A2 non-lethal mutants are representative of the corresponding sample classes. Histograms visualize the mean of normalized relative-integrated-density ± SD values of controls, COL1A1 lethal and COL1A2 non-lethal subjects, and normalized relative-integrated-density for COL1A1 non-lethal (n = 1) and COL1A2 lethal (n = 1) fibroblasts. Statistics was performed on normalized mean relative-integrated-density ± SD values, which were computed on values of Western blot signals from controls (n = 3), lethal COL1A1 mutants (n = 2), and non-lethal COL1A2 mutants (n = 2). §, ¥, and * symbols indicate significant abundance changes occurring between controls and COLIA2 non-lethal mutants, between controls and COL1A1 lethal phenotype, and between COL1A1 lethal and COLIA2 non-lethal mutants, respectively.

