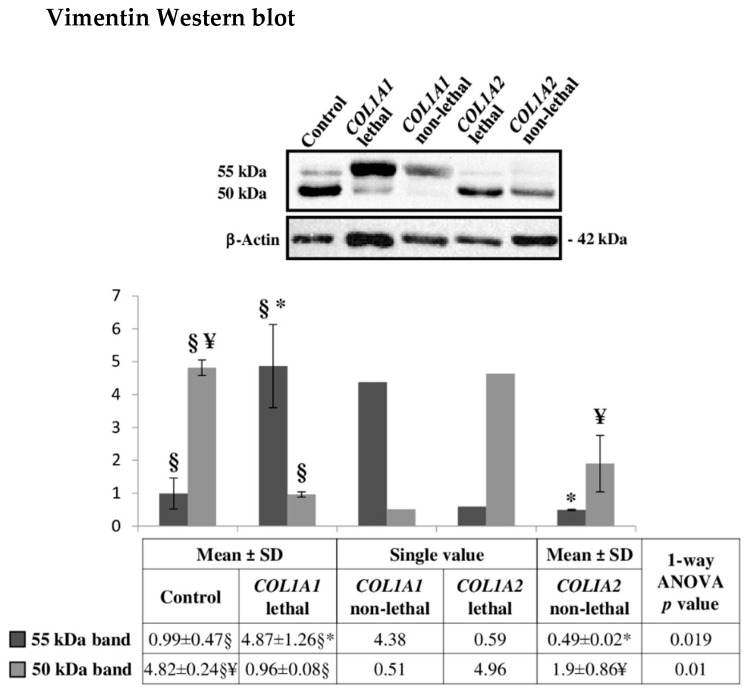
Figure 6.
Representative vimentin Western blot on fibroblasts from dominant OI patients with lethal or non-lethal phenotype. The shown signals of immunostained bands from controls, COL1A1 lethal and COL1A2 non-lethal mutants are representative of the corresponding sample classes. Histograms visualize the mean of normalized relative-integrated-density ± SD values of controls (n = 3), COL1A1 lethal (n = 2) and COL1A2 non-lethal (n = 2) subjects, and normalized relative-integrated-density for COL1A1 non-lethal (n = 1) and COL1A2 lethal (n = 1) fibroblasts. Statistics was performed on normalized mean relative-integrated-density ± SD values, which were computed on values of Western blot signals from controls (n = 3), lethal COL1A1 mutants (n = 2), and non-lethal COL1A2 mutants (n = 2). §, ¥, and * symbols indicate the significance of abundance changes occurring between control and COL1A1 lethal, control and COLIA2 non-lethal, and COL1A1 lethal and COLIA2 non-lethal fibroblasts, respectively. The high SD is due to the wide individual biological heterogeneity of the analyzed samples.

