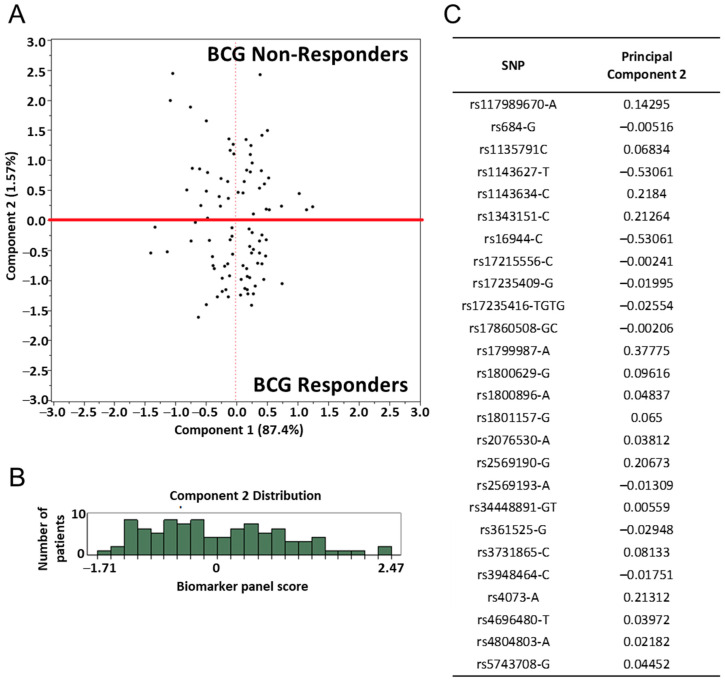
Figure 4.
Principle component analysis (PCA) of gene SNP panel in the pilot patient cohort (MMAIT stage IV BCG-treated). (A) The gene SNP panel score for each patient is represented as a data point on principal component 1 and 2, representing the majority of the data variability. Red line = cut-off point at 0.005. (B) Histograms showing the distribution of principal component 2 among all patients. A cut-off point at component 2 was selected to dichotomize the patients into two groups, termed here as responders and non-responders. (Responders: Comp2 ≤ 0.005; Non-responders: Comp2 > 0.005) The cut-off point was selected at the point of separation in the data distribution. (C) The co-efficient for each gene SNP was determined by PCA. The alleles used for calculation of the co-efficient are indicated.

