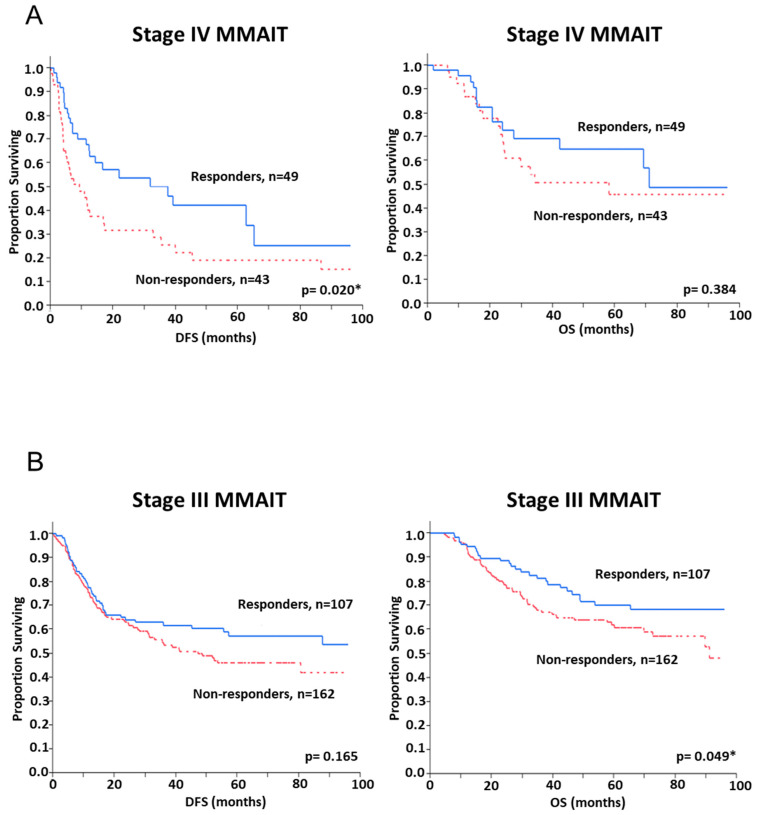
Figure 5.
Kaplan Meier survival curves of patient groups defined by the gene SNP panel. Patients were classified into “responders” and “non-responders” by their SNP score found on the gene SNP panel. Kaplan-Meier survival curves were constructed for these two groups. (A) In the pilot cohort of stage IV MMAIT patients (n = 92), there was a significant difference in DFS between responders and non-responders (p = 0.020). (B) In the verification cohort of stage III MMAIT patients (n = 269), responders had an improved OS (p = 0.049). DFS = disease-free survival, OS = overall survival, MMAIT = Malignant Melanoma Active Immunotherapy Trial. * p < 0.05.

