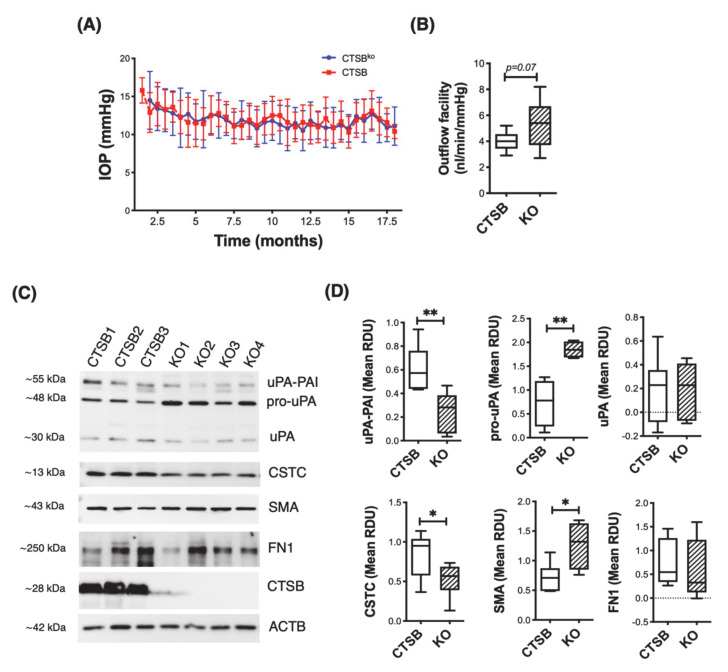
Figure 6.
Effect of CTSB deficiency in outflow pathway physiology and morphology. (A) Mean IOP (mm Hg) over time in CTSBko and CTSB mice. Data are shown as the mean ± S.D., n = 20. (B) Mean outflow facility in CTSBko and CTSB mice (4 m.o.) evaluated ex-vivo with the iPerfusion system. Data are shown as the mean ± S.D., nCTSB = 10, nCTSBko = 11. (C) Protein levels of uPA (uPA/PAI, pro-uPA, uPA), CTSC, SMA, FN1, and CSTB evaluated by WB in whole cell lysates (5 μg) from primary hTM cells. Relative protein levels were calculated from densitometric analysis of the bands and represented in (D). Data are shown as the mean ± S.D. * p < 0.05, ** p < 0.01; t-test, n = 4–7.

